

Like most websites, we use own and third party cookies for analytical purposes and to show you personalised advertising or based on your browsing habits.
Generally, the information does not directly identify you, but can provide you with a more personalised web experience. Because we respect your right to privacy, you may choose not to allow us to use certain cookies. However, blocking some types of cookies may affect your experience on the site and the services we can offer.
For more information, you can read our cookie policy.
How to Analyze Your YouTube Channel
In order to keep improving your YouTube marketing strategy you need tools to control and measure what’s going on with your channel. This is how YouTube Analytics started being part of ‘YouTubers’ lives. A tool to analyze the content of videos and their impact.
YouTube Analytics was launched in 2011 to replace YouTube Insights.
YouTube Analytics is integrated on YouTube Studio: A dashboard for content creators where they can upload videos, live stream and do everything that is related to their channels.
YouTube Analytics: Metrics
To access YouTube Analytics…
▶️ Go to your channel by clicking on your profile icon on the top-right side corner.
It will take you to YouTube Studio. On the left sidebar, you can choose between different options such as dashboard, videos, playlists, or the one that we are covering with this article today, Analytics.
YouTube Analytics section is organized into 4 big blocks with insightful information about your channel and videos:
- Overview
- Reach
- Engagement
- Audience
You can select the period that you want to analyze on the top-right side, for example, you can choose between reviewing last week or the whole month.
If you are only interested in the general performance of your videos, you can press videos on the left sidebar to see their stats, such as views, comments or likes received.
So, what will you find in each of these sections? Keep reading!

Overview
Here you can find an overview of the performance of your YouTube channel: watch time, views, and subscribers.
Also, you can see the top videos ranked by total views.
Reach
In this section, you can thoroughly analyze your videos and see how your users have reached your videos.
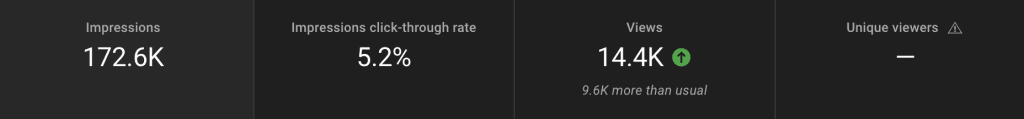
On the first graph, you can check your impressions (how many times people have seen an impression of your videos across YouTube), impressions click-through rate, views, and unique viewers.
Below, you can find valuable information about where users found your YouTube videos, that is, the traffic source.
If viewers access your video from an external source, from YouTube searches or suggested videos, amongst others.
Engagement
On this tab, you can check the time watched of each video, in hours, and how long viewers spent watching your videos on average.
This information will let you understand what viewers like better and if you see the results are good, try to get the most out of these videos.
Audience
Who is behind your channel views?
In the audience section, you can check your unique viewers, the average number of videos watched per person, and the subscriber growth or decline.
Plus, the audience by country, gender, and age and whether they used subtitles to watch the videos or not.
In broad strokes, this is the information that YouTube Analytics offers for your channel. However, this can’t be all.
In fact, it is not. On the top-right side corner, you will see ‘Advanced mode’ where you can get a different level of analysis.
YouTube Analytics 2023
There is no shortage of metrics on YouTube and there are some newer metrics that can really help with your YouTube strategy.
- Watch Time: Watch time is the cumulative duration that individuals spend watching a YouTube video. This metric contributes to your overall watch count. This can therefore count toward monetization. To receive payment for your videos you must gain 4,000 viewing hours in 12 consecutive months.

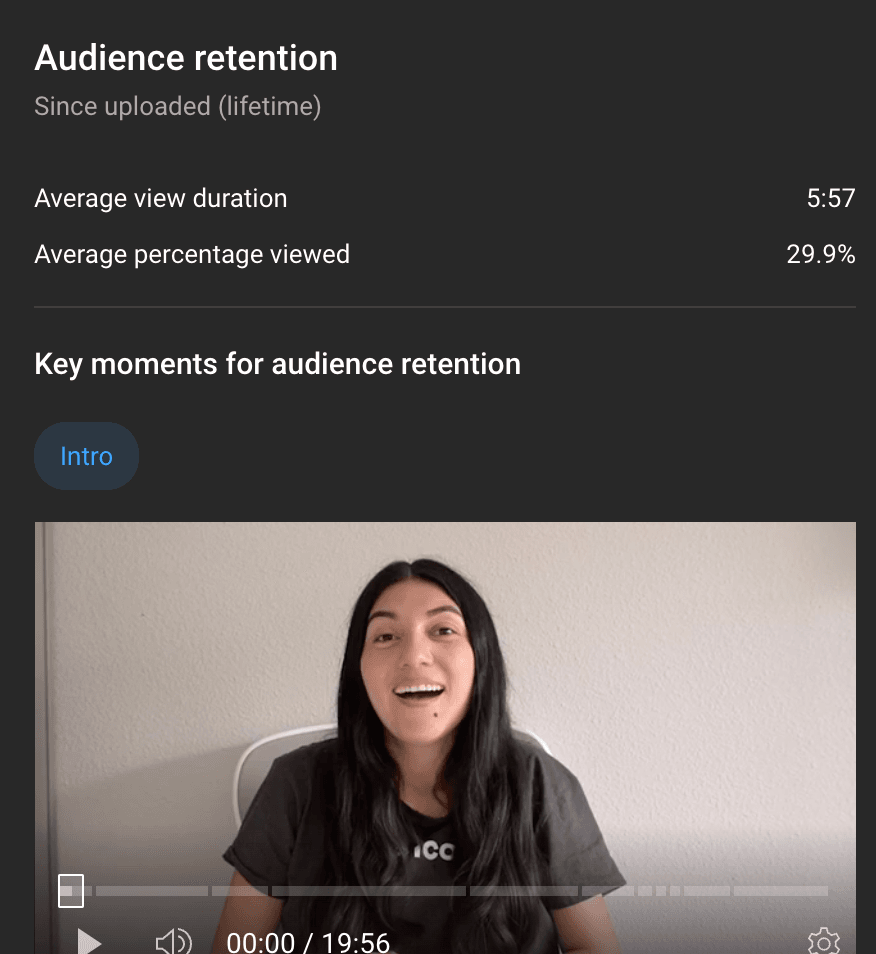
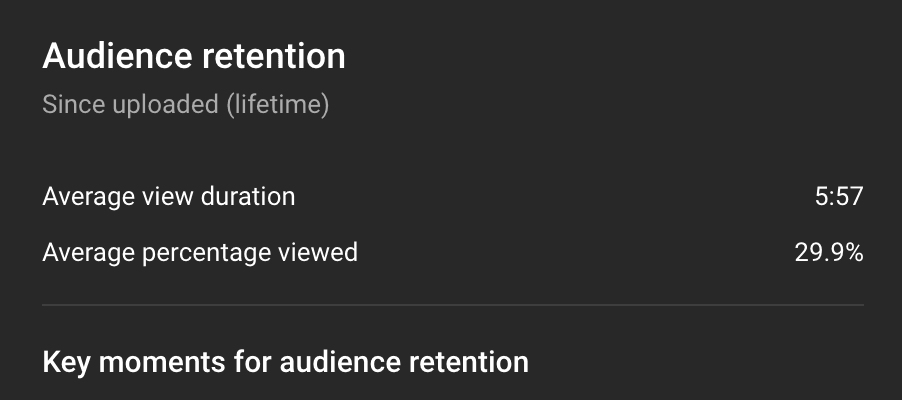
- Average Percentage Viewed: This is the average amount of video an audience member watched. We all know that the attention span of humans has decreased substantially so it is important to look at this metric to see how well you are keeping your audience’s attention.
- Average view duration: This is the total watch time divided by the total number of video plays. This metric also helps you measure how engaged your audience is.
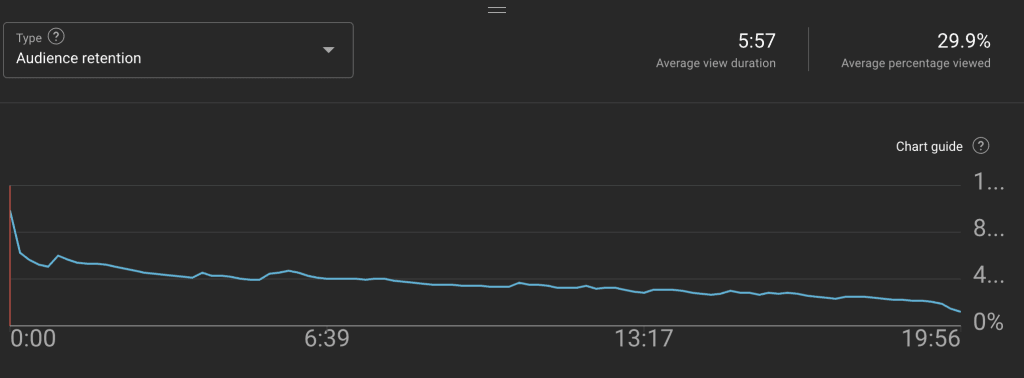
- Audience retention: This metric shows the exact moment when your audience chose to leave your video. This metric helps to show when your audience lost interest.
- Re-watches: This metric is pretty self-explanatory, it is simply how many users watched your video again.
- Impressions click-through rate: This metric measures the ability to prompt your audience to watch your video based on your prompt and description.
- Card Clicks: Cards are CTA’s that YouTubers add to their videos to prompt you to do something whether it’s a new video or subscribe button.
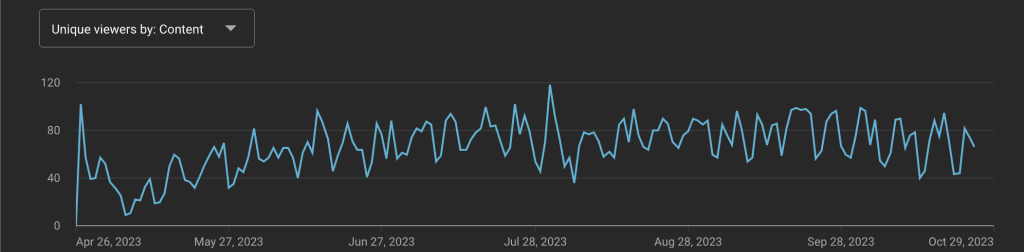
- Unique Viewers: This metric is the estimated number of people who are watching your videos so you can have a grasp on the size of your audience.

- Views Per Unique Viewers: This metric measures the amount of times the viewer watches your video.
- Subscriber Growth: Subscribers are YouTuber’s loyal fans who decided to essentially give your channel a follow.

- Traffic Sources: This metric measures the traffic to the outside sources that you linked in your video.
YouTube Advanced Mode
In this new section, you can dive into more specific information about how your channel is performing.
Depending on the parameter that you are interested in analyzing you can choose from: video, traffic source, geography, viewer age and gender, publication date, subscription status, subscription source, playlist, device type, YouTube products, playback location, operating system, video cards
Also, you will be able to compare metrics or change the date on graphs, and show the information with lines or bars.
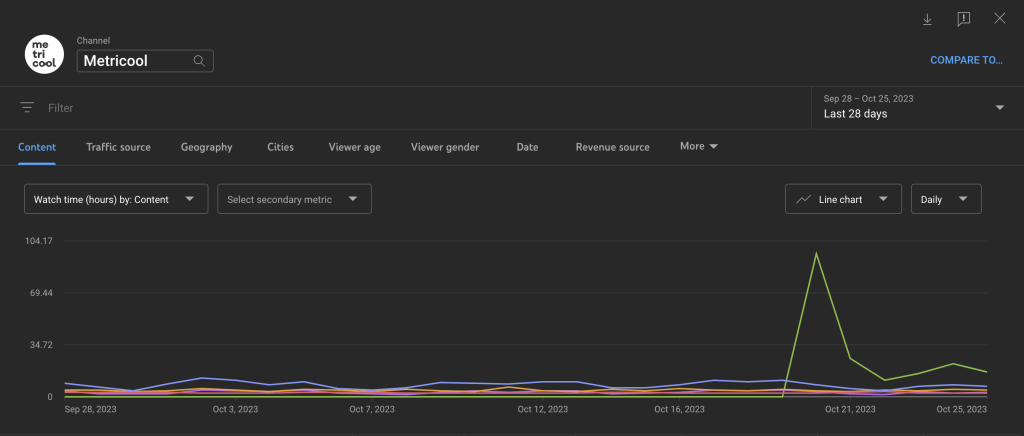
Video
On this tab, you can see a graph with the top 5 videos by views, organized by colors. You can select or unselect them.
Besides, if you are interested in comparing videos, you can combine metrics with the options that appear under ‘Video’.
For example:
You can compare the time watched and views per video to see the differences between them.
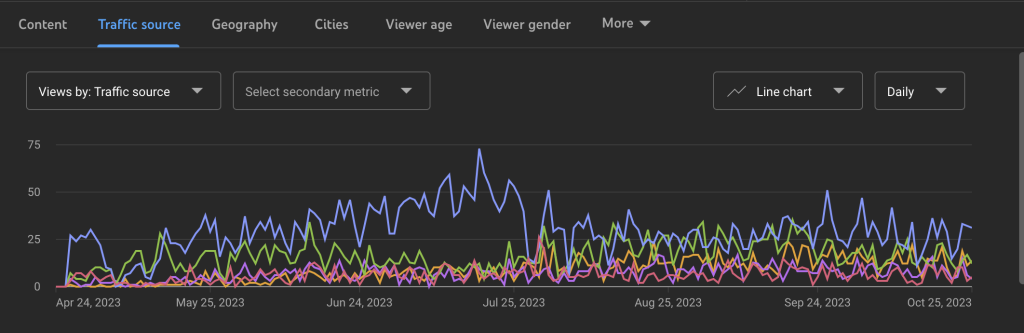
Traffic Source
If you are not clear yet where your views come from, under this tab, you will find YouTube metrics with all the information.
YouTube will provide information about the views, time watched or average view duration for each traffic source.
Geography
You will obtain information about views per region. You can also see data about time watched and average view duration.
Age and Gender
How does your audience behave based on age and gender? In this section, you will discover if your content attracts more men or women, or if it gets more views amongst a young or an older audience.
It helps you optimize your content for your audience.
Date
How has your YouTube channel been performing during the last few days? Better or worse?
On this graph, you can monitor the recent performance of your videos. You will observe whether the views are declining or are keeping a positive trend. This information will help you to decide which strategy is best and what to do.
Subscription Status
Under this tab, you can check very valuable information to understand if your content is succeeding amongst non-subscribers.
This info is crucial to boost your content or improve the description of your videos to reach more people.
Subscription Source
So, do viewers check your videos? do you gain new subscribers or lose them?
In this section, you will gather data about the subscriber’s source, views and time watched, whether you gain or lose subscribers. If you observe that you are losing too many subscribers, it’s time for you to start making some changes to your content.
Playlist
Generating a playlist will help you to organize your videos by topic. Your audience will highly appreciate it.
Here you will obtain valuable insights about the traffic generated by your playlists such as views and time watched. You will learn whether the playlist is working as expected or not.
Device Type
Which devices do your viewers use to access your videos?
Nowadays, it’s easy to access the content from any device. Here you will know which platform your viewers use the most to watch your videos.
YouTube products
Here you will find the views obtained by each YouTube product.
In fact, it refers to the three types of content that YouTube allows you to choose from when you upload a video to the platform: YouTube, YouTube Kids, or Gaming. You will see the views of each one.
Playback Location
In this category, you can see metrics about views or time watched by playback location such as YouTube watch page, embedded player on other platforms, or mobile devices.
Operating System
In this section, you gather information about which operating systems your views come from.
Macintosh, iOS, Android… etc.
Subtitles and language
Here you can check the number of views and times watched that used subtitles/cc and the languages.
Lastly, with regards to languages, you can check the views of the original language and the translation.
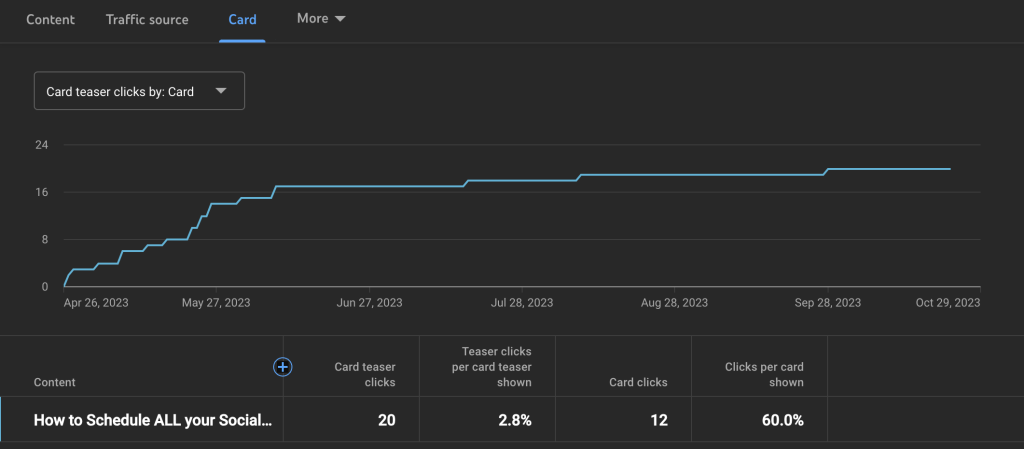
Video Cards
If you didn’t know, you can add cards to your YouTube videos to make them more interactive.
For instance, a call to action to other videos at the end, surveys during the video, or links to other channels.
Here, you can track the number of clicks and interactions per type of card, apart from the views.
Shares
On this tab, you can check how many times your videos have been shared and in which format.
On WhatsApp, Facebook, etc. Did your video go around?
All the reports can be downloaded in different formats, Google spreadsheets or CSV.
Simply click the arrow icon placed on the top-right side corner, next to the ‘x’ to close..
As you can see the metrics offered by YouTube Analytics are extensive and you can get very insightful information. To take your YouTube strategy to the next level, try scheduling your content with Metricool.