

Like most websites, we use own and third party cookies for analytical purposes and to show you personalised advertising or based on your browsing habits.
Generally, the information does not directly identify you, but can provide you with a more personalised web experience. Because we respect your right to privacy, you may choose not to allow us to use certain cookies. However, blocking some types of cookies may affect your experience on the site and the services we can offer.
For more information, you can read our cookie policy.
Social Networks Study: How social networks were used in 2019
We have analyzed all real data from Metricool and have assembled a study which leads us to very interesting conclusions. So, grab a coffee and sit comfortably: it’s time to learn!
Sample of Social media Study
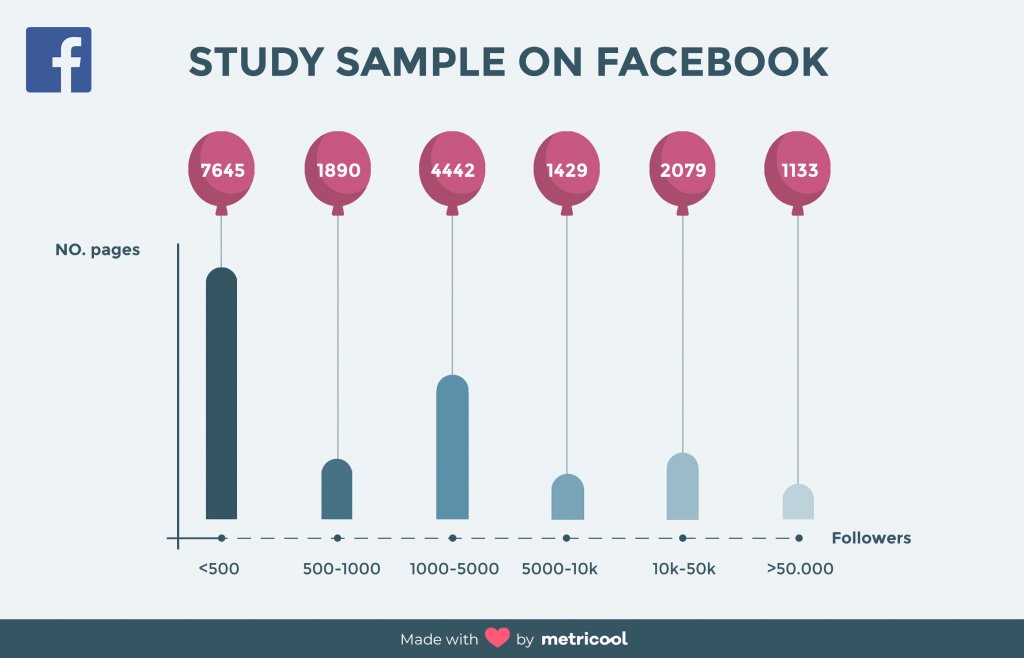
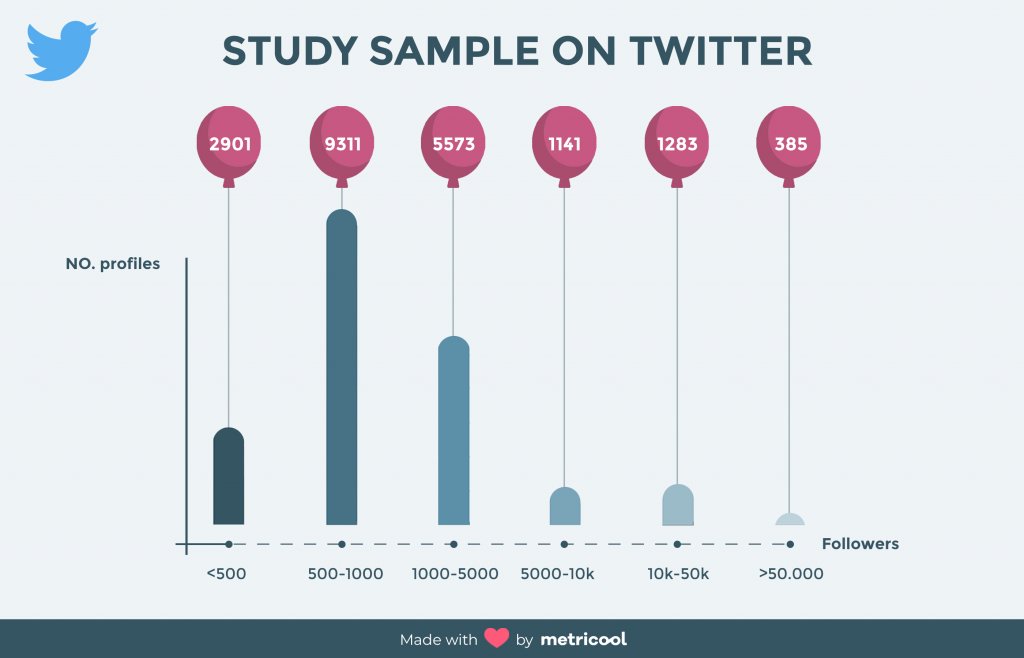
In this study we analyzed a total of 63,791 of the most used social networks: Instagram, Facebook and Twitter. The percentage of accounts with more than 1,000 followers is as follow:
- 43% on Instagram
- 49% on Facebook
- 43% on Twitter
This analysis is based on real accounts and the information is normally obtained from surveys of hundreds of professionals. In this case, over 4 million publications were analyzed, including their interactions and results. As you must know by now, Metricool puts asides opinions and only cares about real data.
✅ Instagram: We analyzed 24,576 accounts with 6,858 followers in average. The account with the highest number of followers in this study has over 20 million (20,165,383 to be exact).

✅ Facebook: We analyzed 18,618 company pages on Facebook with 20,470 followers in average. The account with the most fans has more than 12 million (12,643,217 to be exact).
✅ Twitter: We analyzed 10,594 accounts with 5,510 followers in average. The user with more followers has 1,196,928.
44% of all the analyzed accounts have over 1,000 followers. Mostly, these accounts belong to professionals, brands, accounts to manage the personal brand, influencers, ecommerce and some celebrities.
This is how social networks are used to WIN USERS’ LOVE
Before continuing with the more essential info analyzed in this study, we put together some of the most curious data obtained:
✅ Images without filters on Instagram receive more likes than the ones using them and on average, theyget 21% more interactions. Some of the most popular filters obtain on average, half of the interactions that images with no filters receive.
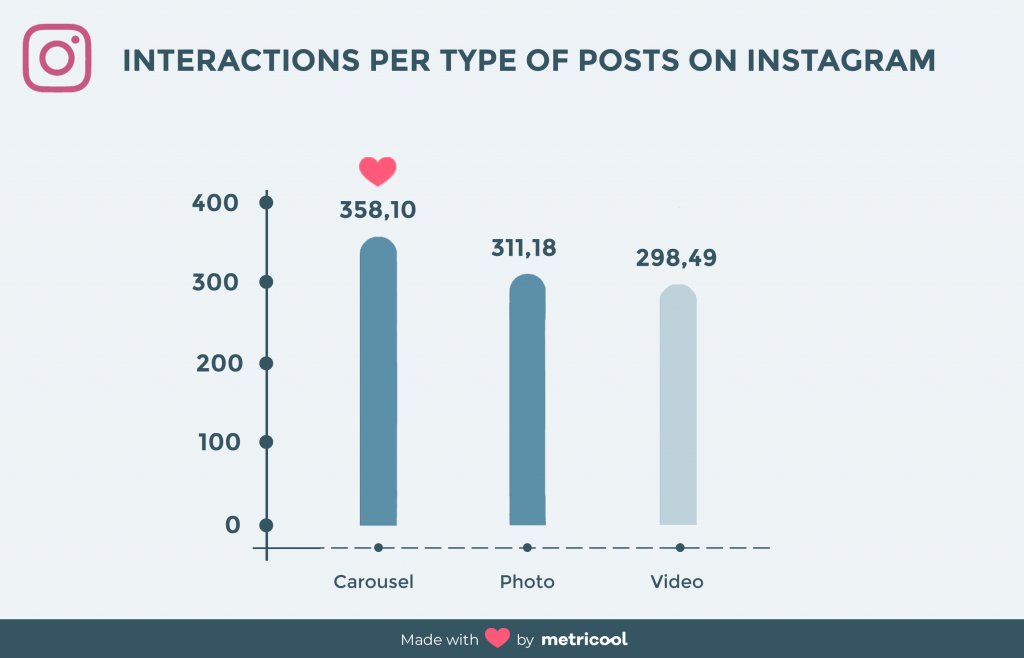
✅ The carousel on Instagramis the least used feature on this social platform as it represents only 7.93% of all publications. However, this type of publications gets more interactions than videos.
✅ The most popular filters used by Instagram users are: Clarendon (3.24%), Juno (1%) and Lark (0.83%). Still, Lark receives more interactions per post with an average of 214.7 interactions per image. The use of other filters is very little, images without filters take more than 89% of total images published.
✅ Sunday is the best day to publish on Instagram. Oddly, Sundays are the worst day to publish both on Facebook or Twitter. That shows how different is Instagram from the rest of social platforms.
✅ On Facebook, videos obtain a higher level of engagement while on Instagram, images shown in carousel format obtain more engagement. On Twitter, original tweets are more popular than retweets. Below, you can find all the info extracted from our analysis based on real data from more than 63,000 professional accounts. At the end of this article, we also offer all our conclusions.
Social media study: Detailed info about the data
Posting Frequency
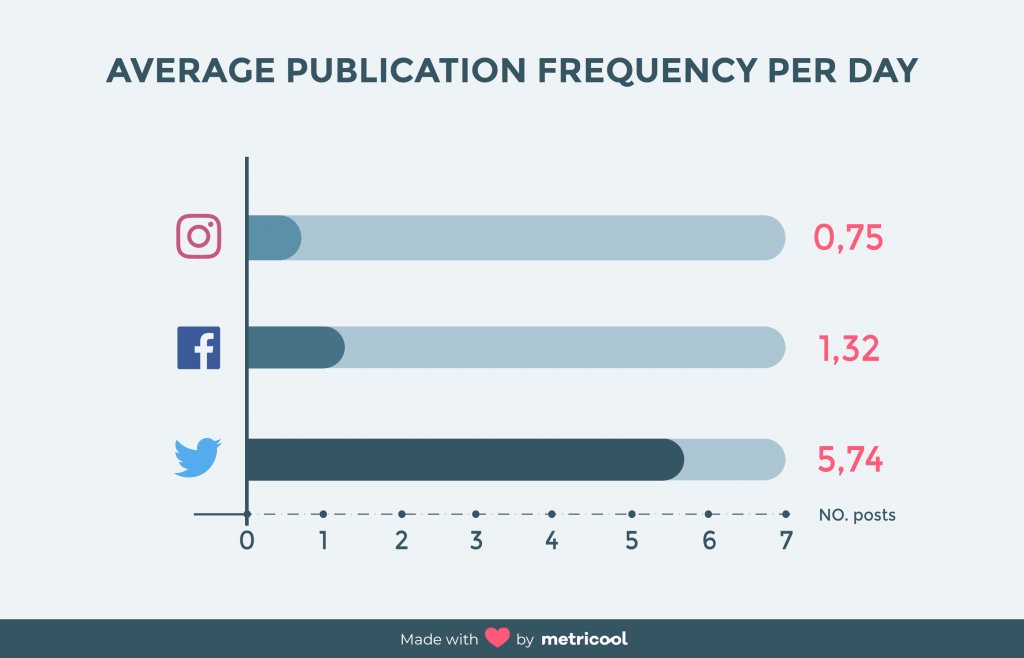
In which social networks is posting more frequent? We organized social networks by order of posting frequency in 2018:
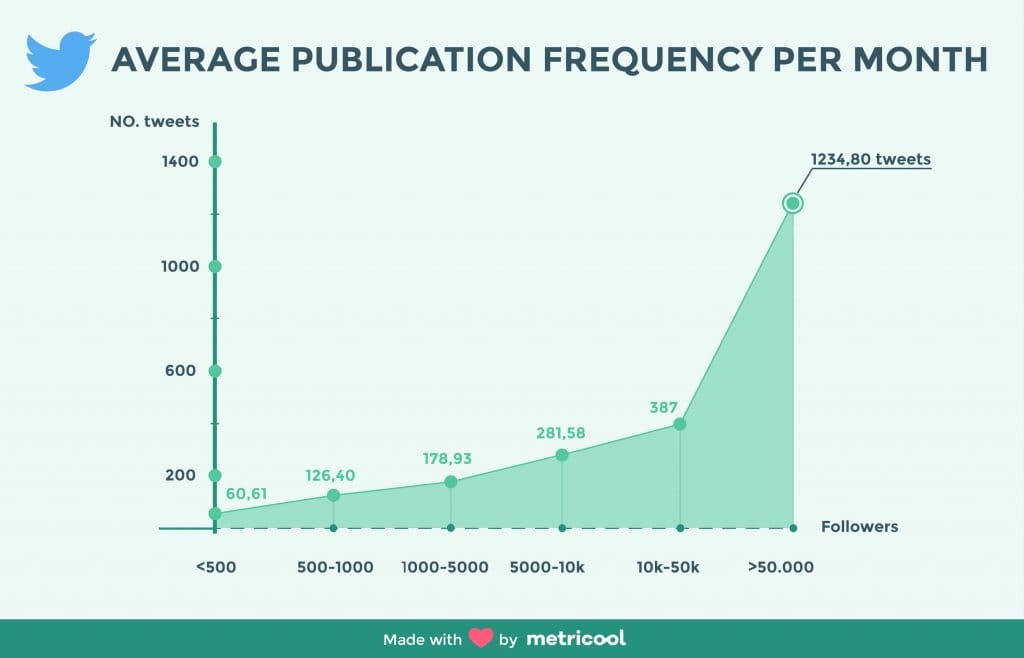
Twitter is the social network ahead with a monthly average of 173 publications per account: 5.74 daily tweets. If we consider the size of an account, we can conclude that as the number of followers grows, the frequency of its posts also increases. For example, if you have an account with less than 500 followers, you should publish twice a day (60 per month). However, if you have more than 50,000 followers, be prepared to post at least 1,000 monthly tweets!
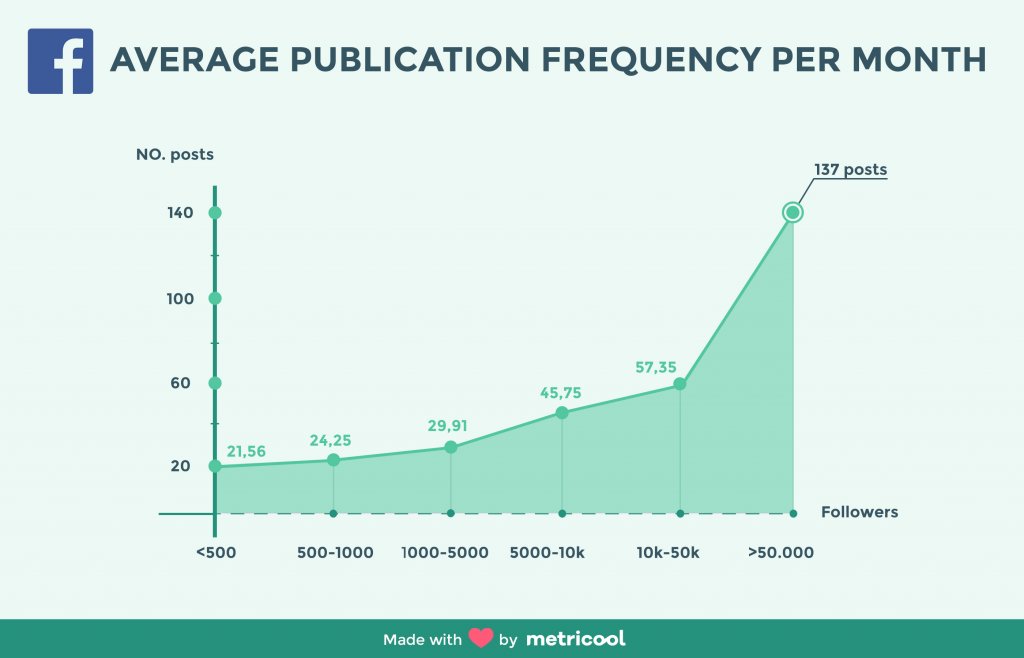
Facebook: An average of 39.58 publications per month (1.32 daily posts). As with Twitter, the amount of publications depends on the size of the community. From 21 monthly posts by pages with less than 500 followers to 137 monthly posts by pages with more than 50,000 followers.
Instagram: In last position with 21.03 posts a month (0.75 daily posts). So, Instagram’s posting frequency is the lowest of the three and as with the other two, the more followers an account has, the more often you should publish.
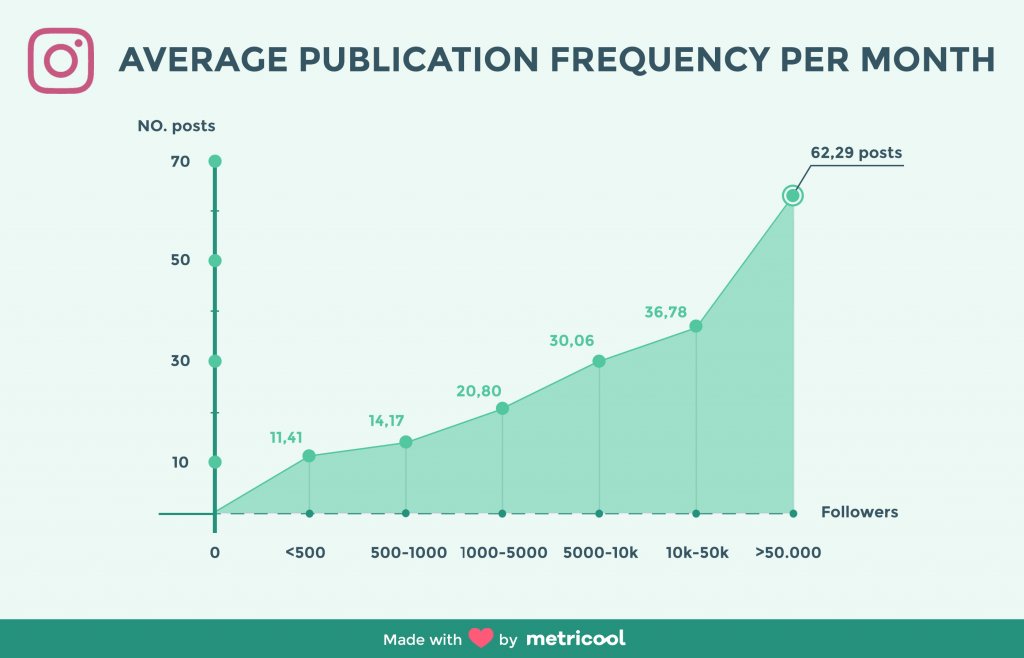
In the graphs we can see the direct relation between the posting frequency and the number of followers. The higher the number of followers, the higher the publishing frequency. In all three charts, there is a big difference between the accounts that publish very often and the rest. So, social networks reward frequent publications. The more content you write, the higher your reach. But remember that you shouldn’t neglect the quality of the content.
Types of publications most used on each network
What type of content is more popular in social networks? To give you an answer to this question we have analyzed 63,791 accounts from Facebook, Twitter and Instagram and 4,006,054 total publications.
Type of publications on Instagram
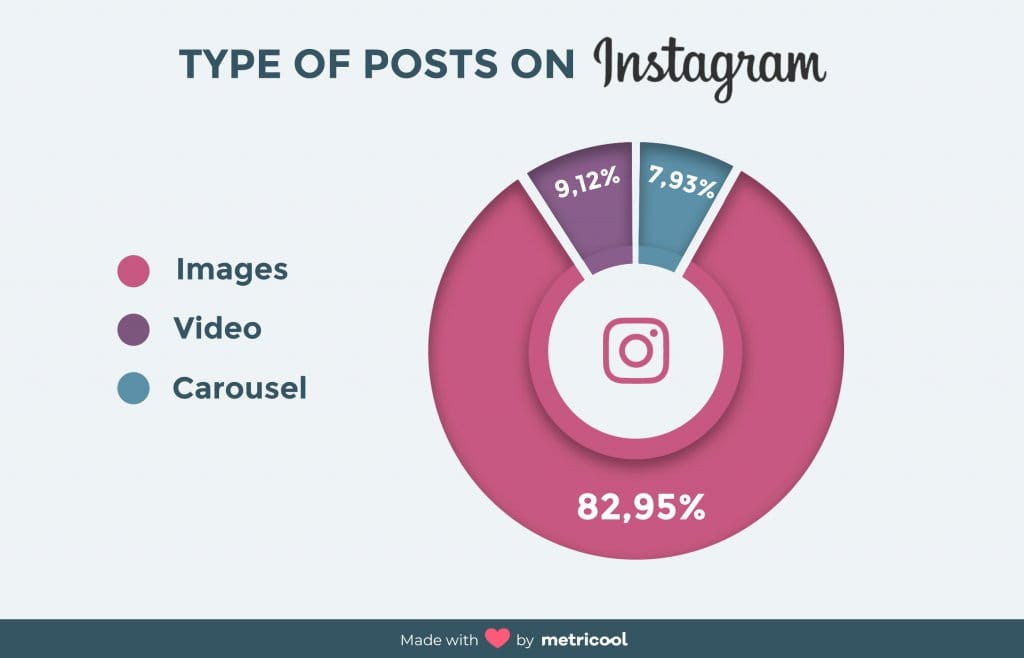
We have analyzed 321,568 publications from Instagram. Posting videos is rising in popularity but the use of images is still ahead.
- 83% of total posts are images.
- 9% videos.
- 8% images using the carousel
As you can see, despite the fact that it’s said that videos are the most popular content and that brands are hedging their bets on this format, only 1 out of 10 publications on Instagram made by brands are actually using videos. There is no doubt that the production cost of a video is much higher than the cost of an image or photo and the final outcome doesn’t always justify the investment as you will soon learn.
Type of publications on Facebook
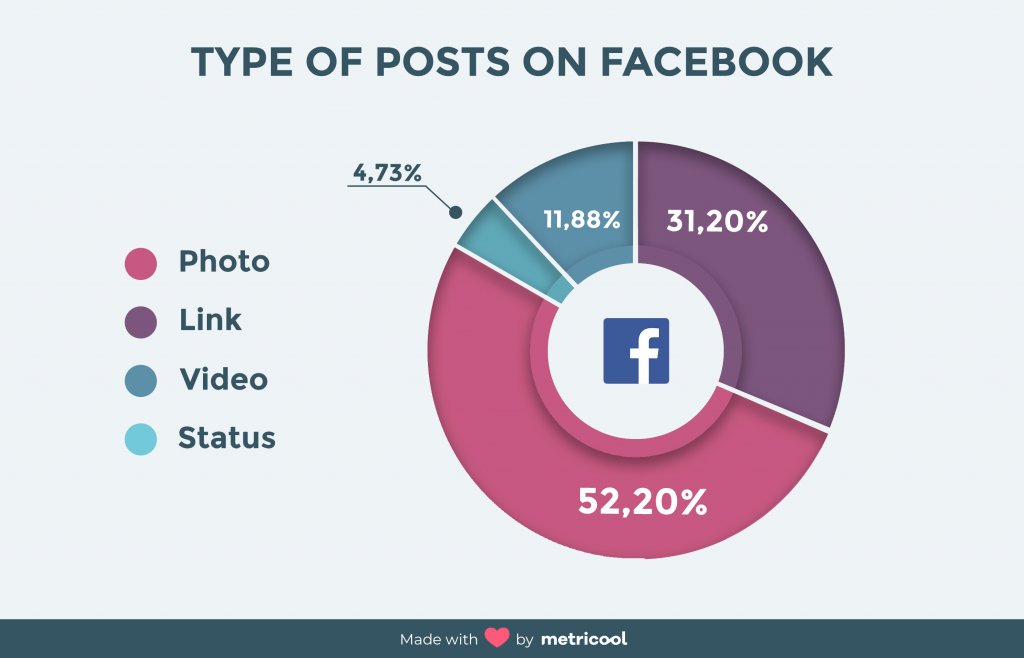
We have analyzed 614,882 publications from Facebook. This sample is significant enough to reach some conclusions about which publications are more popular and work best.
- The use of images is still the most popular covering 52% of the total publications in this study
- Links are the second in popularity with a 31% of total shared content
- Videos only appear in 88% of the total analyzed posts.
- Status (only text publications) are in last position with 73% of total posts.
Facebook pages from brands mainly focus on sharing images and links, probably because these two types of publications help them to more effectively reach their main objectives with this social network: Branding and traffic.
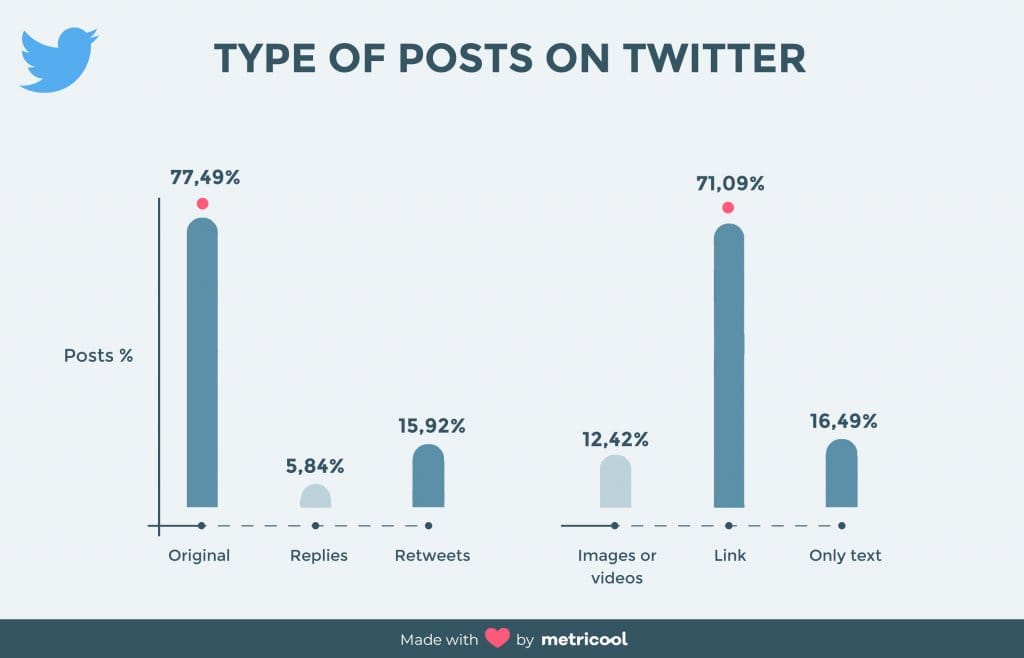
Type of publications on Twitter
We have studied 3,069,604 publications to learn which type of content succeeds on Twitter.
- 50% of total tweets are original. That is, messages that are trying to start a conversation.
- 84% of total tweets are answers to tweets from other users or their own (like Tweet threads).
- 68% are retweets or mentions.
On the other hand, within these tweets, 13% of total posts included media files such as, images, videos of GIFs. We should highlight that the use of photos accompanying tweets was the most common. Probably the most remarkable conclusion from this study with more than 3 million tweets analyzed, is that almost 75% of them included a link. That shows, that the main goal for brands on Twitter is to increase the traffic to their websites or to provide a more comprehensive content than the one they can share directly on this platform.
In which social platform can we find a higher number of interactions? What type of publications and content work best?
Study of Instagram Interactions
We included 321,568 publications on Instagram in our analysis with a total of 98,832,879 likes. The info gathered from this study illustrates the importance of these publications.
- Each publication gets 307 likes in average
- Each publication obtains an average of 6.4 comments.
From here, you can conclude how valuable comments are against ‘likes’ on Instagram. With a mobile device it is much easier to leave a ‘heart’ than to write a comment. The higher number of interactions come from Instagram’s carousel photos. Strangely enough, this content is the least used by brands. This is significant since videos are costlier to produce. Also, images receive more interactions than videos. We should also consider that posts can’t be shared on this platform, so a publication can’t become viral as happens with other social networks.
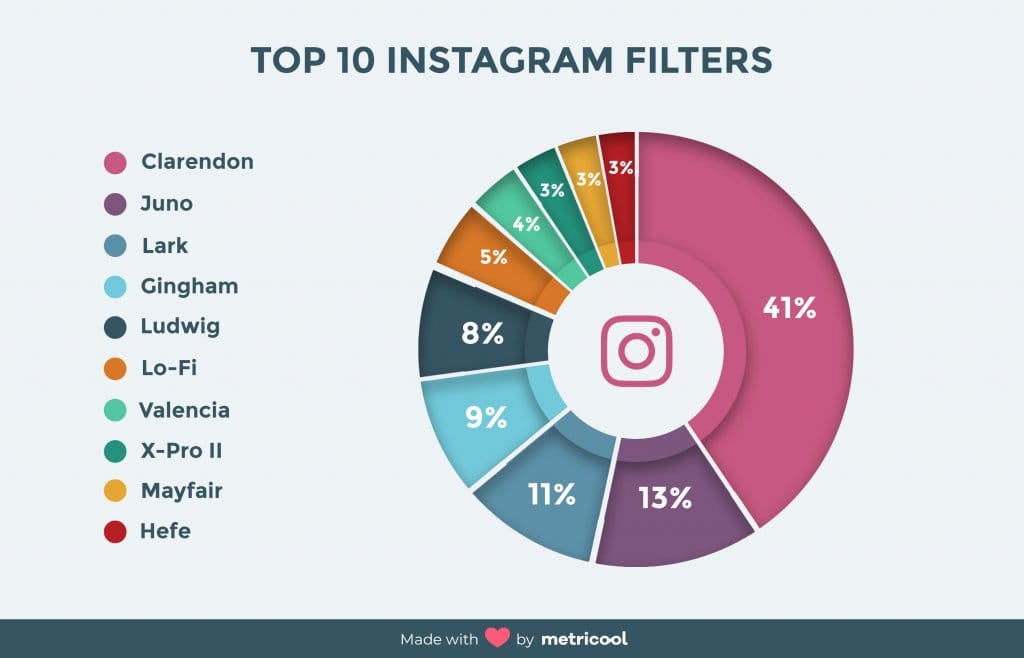
Bonus Track: Instagram interactions using filters
Publications with no filters receive a higher number of interactions than when filters are in use. So now you know! At the end of the day, audiences appreciate and like more un-doctored images, without artificial touches. It’s harder than it looks to obtain the desired results from filters. In the following graph we show the 10 most popular filters: Amongst 42 filters analyzed, “Clarendon” (3,24%), “Juno” (1,00%) and “Lark” (0,83%) stand out. Although Lark is not the most used, it receives more interactions than the other two. In particular, 214 interactions per post. The rest of the filters are insignificant in percentage.
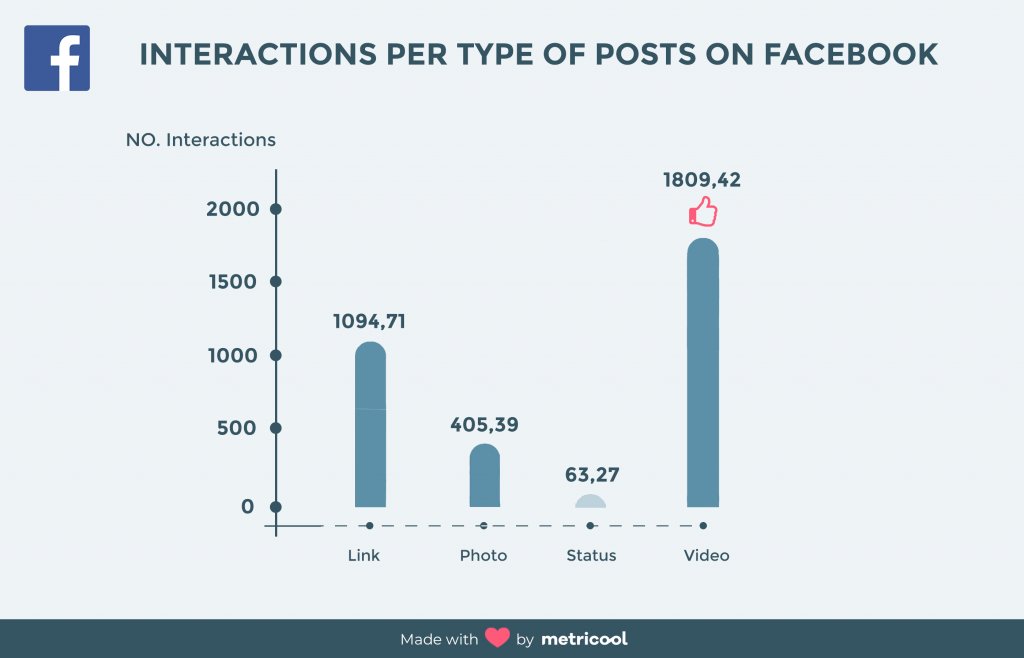
Social media study: Facebook Interactions
We included a sample of 631,934 publications from 18,618 Brands Facebook Pages. All these publications collect 86,426,512 reactions. An average of 769.7 per post. Videos are the format that receive more interactions with 1,809.43 on average. However, as we saw earlier, they are not in use as often due to the high costs involved in creating them. Videos are shared more than other types of publications. For this reason, videos become more viral, multiplying their impact on this platform and increasing their reach.
Study of Twitter Interactions
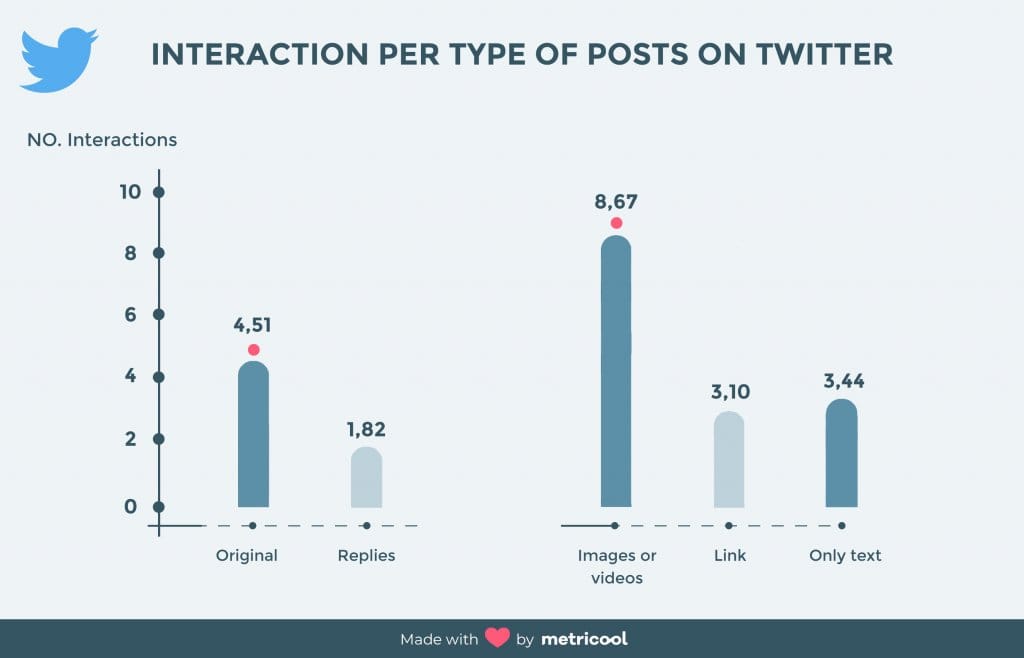
The interactions on this social network are much lower on average than the social networks analyzed before. However, it’s important to consider that much more content is shared on this platform since it is mainly focused on information and current events. 3.17 is the average of interactions per tweet and there is a big difference between:
- Original Tweets: 4.5 interactions per tweet
- Tweets replies:82 interactions per tweet. Actually, these replies could be also considered interactions generated by original tweets at the same time.
Tweets classified by the type of content published
If we analyze tweets considering their content, we observe that:
- Tweets including a photo/video get more interactions, 68 in average
- Tweets with only text or a link have an average of 44 and 3.10 interactions per post respectively.
Tweets using visual content work better than the ones that don’t include a photo or video. Despite being a social network with an informative nature, the quality of the content is important.
Best days to publish
Which days are best for publishing? At what time does the chance of getting more interactions increase on each social network? This analysis is based on the activity level of followers of the accounts analyzed on each social network. That is, when followers are more active and therefore, more receptive to interact with the brands included in our study.
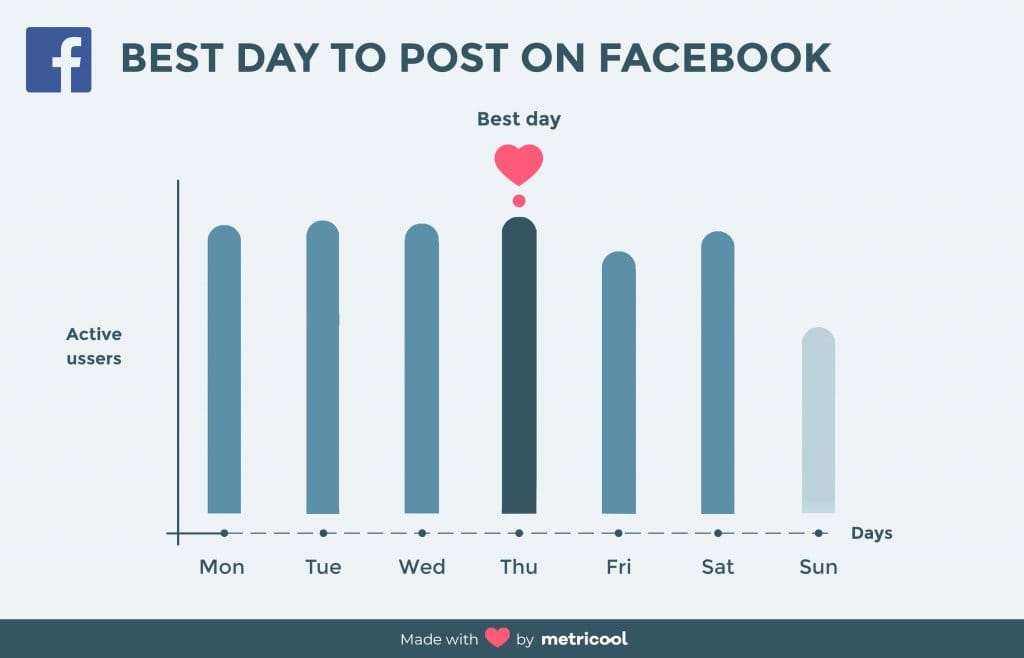
Study about which days are best to publish on Facebook
Based on followers’ activity of over 18,000 pages analyzed we can assure that, in general, the best day for publishing on Facebook is on Thursdays and the worst day is Sunday (37.7% worse than Thursdays). Fridays follow Sundays in terms of worse performance, 11.55% than Thursdays. Mondays, Tuesdays and Wednesdays don’t show a significant difference with the best day of the week, Thursday. There is no doubt that the activity of the followers of the analyzed accounts use Facebook mostly on weekdays.
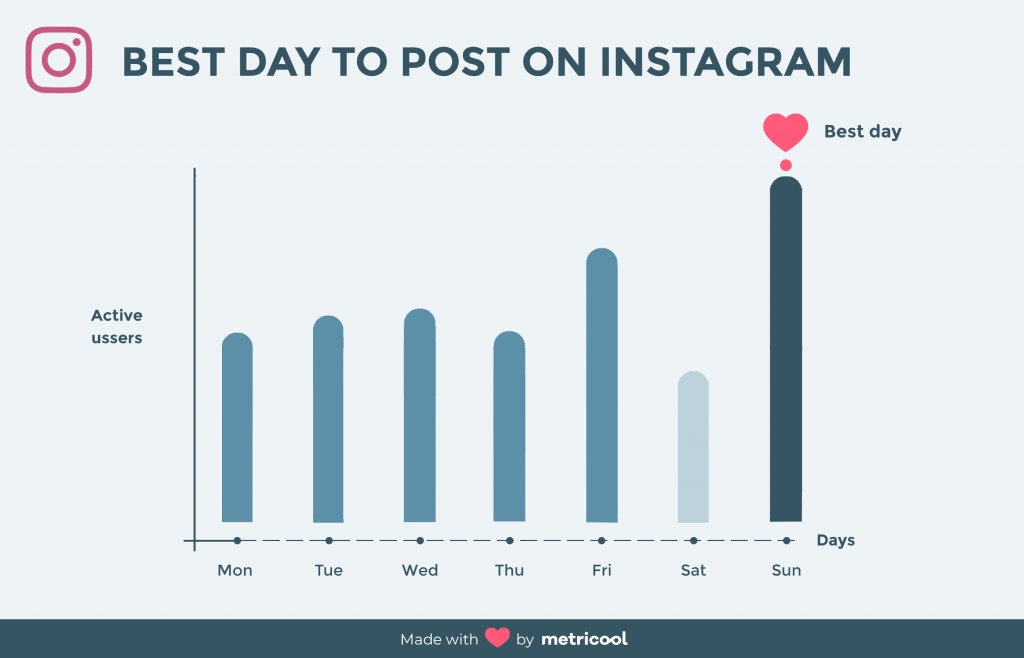
Best days to publish on Instagram
The best day to publish on Instagram is clearly on Sundays, followed by Fridays. In last place, becoming the worst day for posting on Instagram would be Saturdays (7.39% worse than Fridays). From Monday to Thursday, the activity level of these followers is a bit lower. It’s surprising how different this is from Facebook.
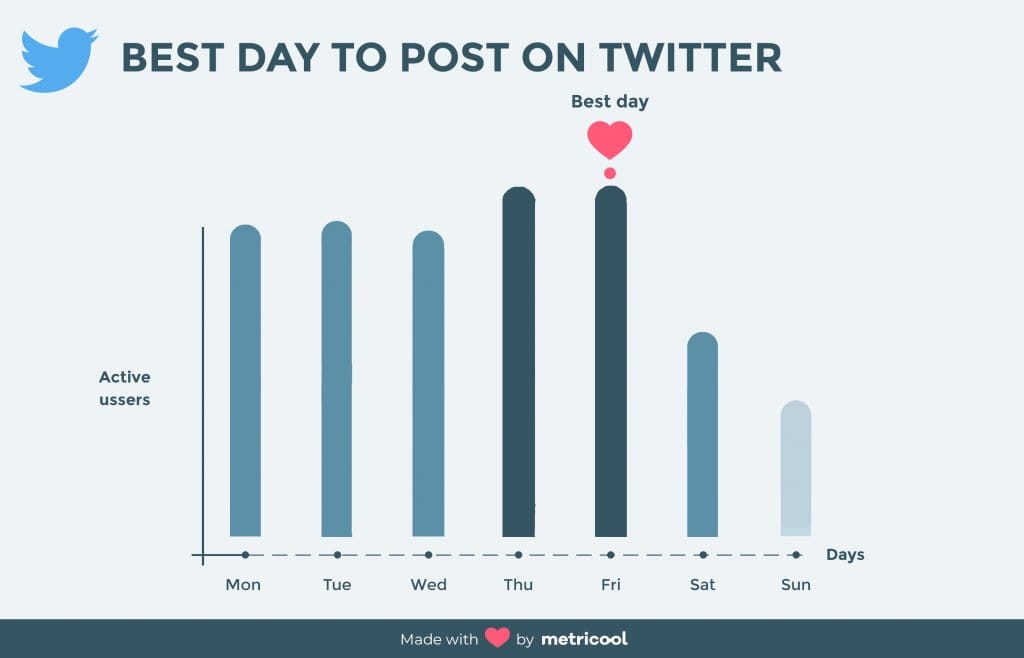
Best and worst days to publish on Twitter
According to the info obtained through the study, the best day to publish is on Fridays as it’s when the followers of the accounts included in the study are more active. This day is immediately followed by Thursday, as it’s only a 0.01% worse regarding the followers’ level of activity. Both days are practically the same. The worst day to publish is on Sundays, 11.64 % worse than Fridays.
Best hours to publish on Social Networks
What’s the best time of the day for publishing? Are there better hours than others? This analysis is again based on the activity level of the followers’ accounts included in the study. That is to say, when the followers of these accounts are more open to interact with brands.
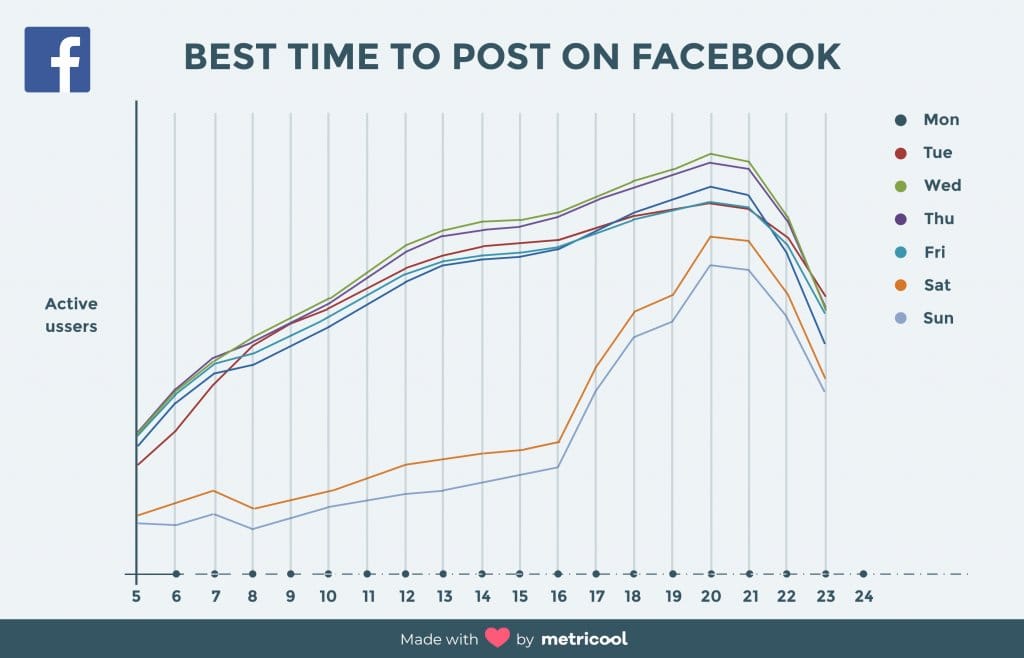
Best and worst hours to publish on Facebook
The best time to post on Facebook during workdays is between 8 pm and 9 pm. Obviously, the worst hours would be at dawn. After that, it will keep improving until late in the day.
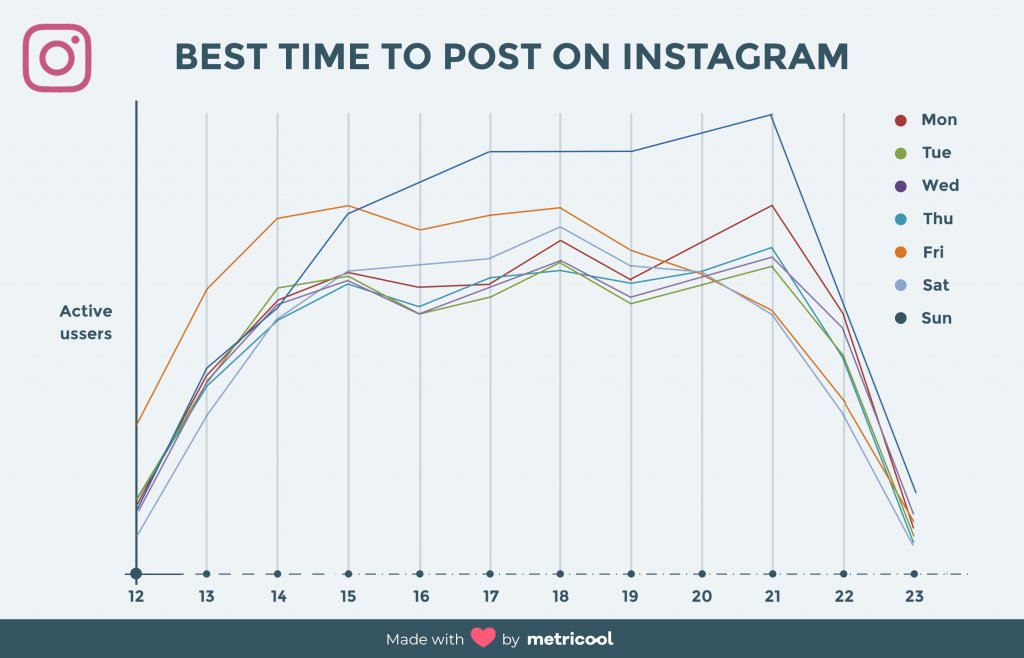
Best hours to upload content on Instagram
Normally, the best hours to publish on this social platform is around 9 pm, although 6 pm could be also a good time, especially on workdays and on Fridays a good time can be even before, 3 pm.
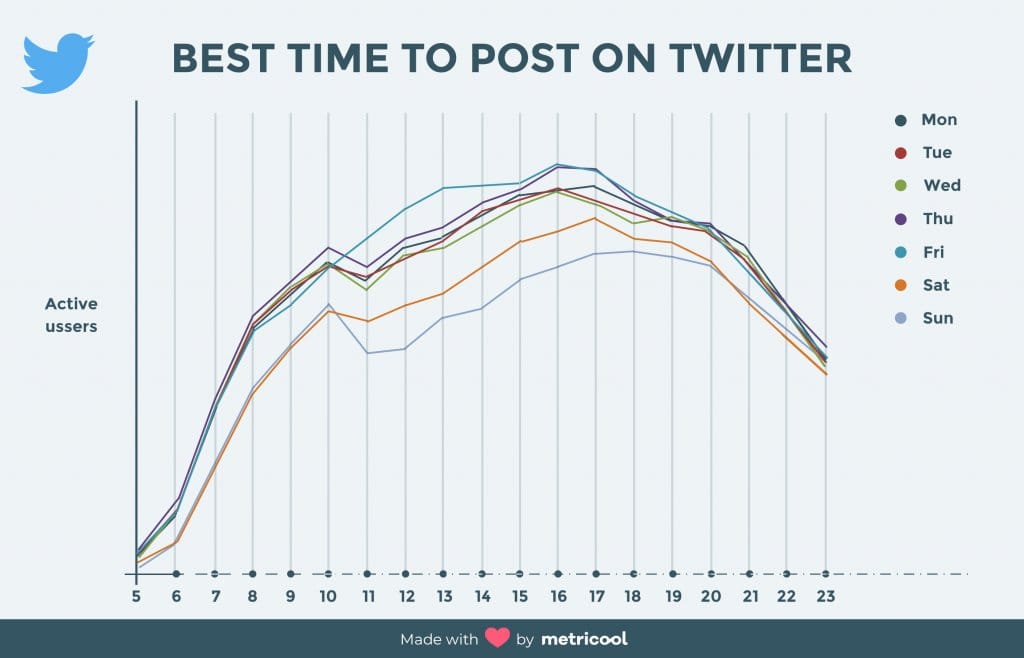
Best hours to publish on Twitter
From Mondays to Fridays, the best time is between 4 pm and 6 pm. On the weekends, the best time is at 5 pm on Saturdays and 6 pm on Sundays. During the morning, 10 am is the best hour to post, but be careful and don’t do it later than this time, because the activity level drops dramatically during the following hours.
Conclusions of these social networks study
Conclusions about posting frequency
According to the data analyzed, the posting frequency increases in parallel to the growth of followers. The more followers, the more content is published on these three social networks. Furthermore, as the graphs showed at the beginning of this article, there is a big difference between those accounts that publish often on Twitter and Facebook and those that publish less. On the other hand, the difference is not that relevant on Instagram.
Conclusions about the type of publications
Regarding the content uploaded on social networks, what attracted our attention was how little videos are used on Instagram, Facebook and Twitter. This format is starting to gain importance and it’s considered the most complete at multimedia level, still the use of videos is less than expected. If we compare Instagram and Facebook, the data obtained are very different. Facebook allows more different types of publications beyond just photos and videos, with the objective of increasing the possibilities of a post going viral. This is an important factor that directly affects the amount of interactions on a publication. If for example a post is shared on Facebook, it will be easier to reach the desired number of interactions than if it was published only once without the possibility of being shared, like on Instagram.
Conclusions about interactions per type of publication
Instagram is known for obtaining a high engagement rate. While likes and comments are the only interactions allowed on Instagram, on Facebook, users can interact using reactions, comments, shares and clicks. For this reason, posting on Facebook increases the probability of going viral and therefore, more interactions. On Facebook, we have analyzed 631,934 posts from 18,618 pages. If we only compare the number of likes received on publications from both Instagram and Facebook, without considering the rest of the interactions, Instagram clearly receives more likes on average. So, although Facebook obtains a higher number of interactions when we exclusively look at ‘likes’ Instagram is ahead. Another point that we should add, videos on Instagram are used more often than carousels, however the carousel format receives more interactions. We also obtained interesting data on Facebook that shows us how relevant videos are on this platform. From the total publications analyzed on Facebook, we observed that videos only represent 11.94%, a much lower percentage than images (52.40%) and links (30.89%). However, when we look at the number of interactions obtained by each type of publication, we can see how videos are the format that gather more interactions with an average of 1,809 per post, while images and links received 405 and 1,095 on average respectively. We should point out that from all the interactions analyzed, the number of videos shared is very high, meaning videos tend to go viral on this platform.
Conclusions about which days are best and worst to publish on these networks
Starting with Instagram, Mondays and Thursdays are less popular, but this is easy to explain since this social network is mostly for personal use, and as such, the quality of the content stands out. These days (Monday to Thursday), the use of social media is more oriented to the professional world and users have less time for leisure or time to dedicate to their own networks. Also on Saturdays the activity is lower, but it increases again on Sundays. As we just mentioned, Instagram is a very personal social network, where users look for quality photos and videos. So, it’s easy to understand why Sundays are popular since users have more spare time. Regarding Facebook, the data showed clearly that this platform is more active from Monday to Thursday, Thursday becomes the best day of the week. We observed that this social network is frequently use during weekdays by the analyzed users. On Friday, the activity drops although Sunday is the worst day ewith considerably much lower interactions. Lastly, on Twitter we can conclude from the analyzed accounts, mostly professional, that they have two main objectives:
- One would be that brands focused on a professional audience that is more active from Monday to Friday.
- The other target would be those brands focusing on final consumers, more related to leisure and those users more active from Thursday to Sunday.
- These two strategies coincide on Thursday and Friday, mixing both types of followers, making it easier to reach a larger audience.
In conclusion, this social network generally addresses a professional public. We also observed, that on weekends, followers are much less active if we compare with the rest of the week, since these professionals are more active on weekdays.
I don’t want to finish without expressing my gratitude to Isabel, Alberto, Gianfranco and Sara for helping gather all the information for this study.
THANK YOU!