

Like most websites, we use own and third party cookies for analytical purposes and to show you personalised advertising or based on your browsing habits.
Generally, the information does not directly identify you, but can provide you with a more personalised web experience. Because we respect your right to privacy, you may choose not to allow us to use certain cookies. However, blocking some types of cookies may affect your experience on the site and the services we can offer.
For more information, you can read our cookie policy.
Facebook Ads study: Advertising on Facebook based on real data
We analyzed a total of 148,187 campaigns run by 1,132 advertising accounts to carry out this study about Facebook Ads. The total investment of these campaigns was exactly 3,993,540.35 US dollars. We examined data about impressions, reach, number of clicks and cost. We also calculated the average CPM (cost per thousand impressions or mile) and CPC (cost per click).
We extracted the following general information from the campaigns used for our analysis:
- 3,153,029,696 impressions.
- 2,841,632,852 reach.
- 80,772,268 clicks.
- 3,993,540.35 USD investment.
- 26 USD average CPM y 0.05 USD average CPC.
The campaigns included in our study were launched in different countries from Europe, North America and Latin America. Therefore, the currencies used to configure the campaigns differ in many cases. We converted all the data into US dollars (USD) to make the costs and investments comparable among the different countries.
Facebook Ad Campaigns Objectives
In our study, we included all the different types of campaigns that Facebook lets you choose from. These are the advertising objectives that Facebook offers to run your campaigns:
Awareness
It helps you to generate interest in your services. Within this objective, it is possible to choose between brand awareness, to obtain more notoriety for your brand and get more people interested in it, or reach, to show your ad to as many people in your audience as possible.
Brand awareness: This objective allows advertisers to show their ads to people who are more likely to recall them.
Reach: It allows you to get to the maximum number of people in your audience from Facebook and also to know how often they visit your ads. It can consolidate awareness or change the perception of your brand.
Consideration
You will stimulate interest towards your brand with this objective. It is divided into 6 subcategories: Traffic, to drive traffic to your website or Facebook page. Engagement, to get more people to see and engage with your publication or Facebook page. App installs, if you have an app, this will be your first step to launching it to stardom. Video views, as the name implies, the objective is to get more people to view your videos. Lead generation, with the objective to capture potential clients and lastly, messages.
Traffic: To attract people to a specific destination in or outside Facebook. It takes quality visitors to different places on your Facebook page or your own website.
Engagement: To get more people to see and engage with your publication or Facebook page. This objective is subdivided into four objectives. We focused on two of them:
- Boost your posts (Post Engagement): With this type of ad, you can share information about your company. You can use it to show your publications beyond your page and encourage the audience to take actions you care about.
- Promote your Page (Page Likes): Getting more “page likes” is the objective of this type of campaign. That is, getting more followers. Showing a positive external image, generating trust or creating a community for your communication strategies are the targets for companies looking for increasing the number of followers.
App installs: Apps can play an essential role for your business growth. These ads put you in contact with those users who are more likely to download your app and therefore, get more people to use it.
Video views: This objective was designed to show your ad with videos to an audience that is more inclined to watch it.
Lead generation: Campaign that captures potential clients’ data from native platforms of this social network.
Messages: This target was designed for advertisers who want to start a conversation with clients. It gets more people who are more likely to respond to your business to encourage them to take action that you care.
Conversion
This objective encourages the people who showed interest in your brand to finally buy your products or services. You can choose between conversions, to attract users to your webpage to reach your sale or downloading goals, catalog sales or store visits.
Conversions: It increases conversions on your website. It draws more users to your website so they can take specific actions.
Catalog sales: a list with all the products that you want to promote.
Store visits: If you are an advertiser and run a business in different locations, you can use this objective to run a dynamic ad campaign for those people who are close to your business.
Facebook Ads Data Analysis
Once we know the different objectives that you can choose from for your Facebook ads, we analyzed the info drawn from our sample.
Most popular ad campaigns
From the 148,187 campaigns analyzed, the most popular types of campaigns used by companies were:
- Post Engagement: with a 65.61% total
- Traffic: 13.02%
- Video views: 7.89%
- Page Likes: 5.53%
- Conversions: 5.26%

THE MOST POPULAR OBJECTIVE FOR BRANDS IS POST ENGAGEMENT
We deduced from the data, that the professionals who manage Facebook and Instagram accounts, are mainly focused on getting more visits to their posts and obtaining as many interactions as possible from the audience. In this sense, Facebook encourages brands to invest part of their budget in getting more visibility and interaction.
Besides, it’s the easiest type of campaign to configure since you can do it without Power Editor. Therefore, this type of campaign is accessible for any user, even without a good understanding of Facebook’s ad campaigns.
THE SECOND MOST POPULAR CAMPAIGN OBJECTIVE IS TRAFFIC
This objective allows brands to make their investment profitable fast. That is, increase the return on the money invested. It’s also very easy to monitor through tools like Analytics or Metricool.
THE THIRD OBJECTIVE IN POPULARITY IS VIDEO VIEWS
This third objective is in line with post engagement since it basically consists of creating content and asking Facebook to distribute it beyond what you’d get organically.
So, we have learned that part of the budget invested in Facebook or Instagram must go to the distribution through advertising, and part to create the content.?
CONCLUSION
Brands invest their Facebook or Instagram budget in distribution through ads and the creation of their own content
Campaigns with the highest investment
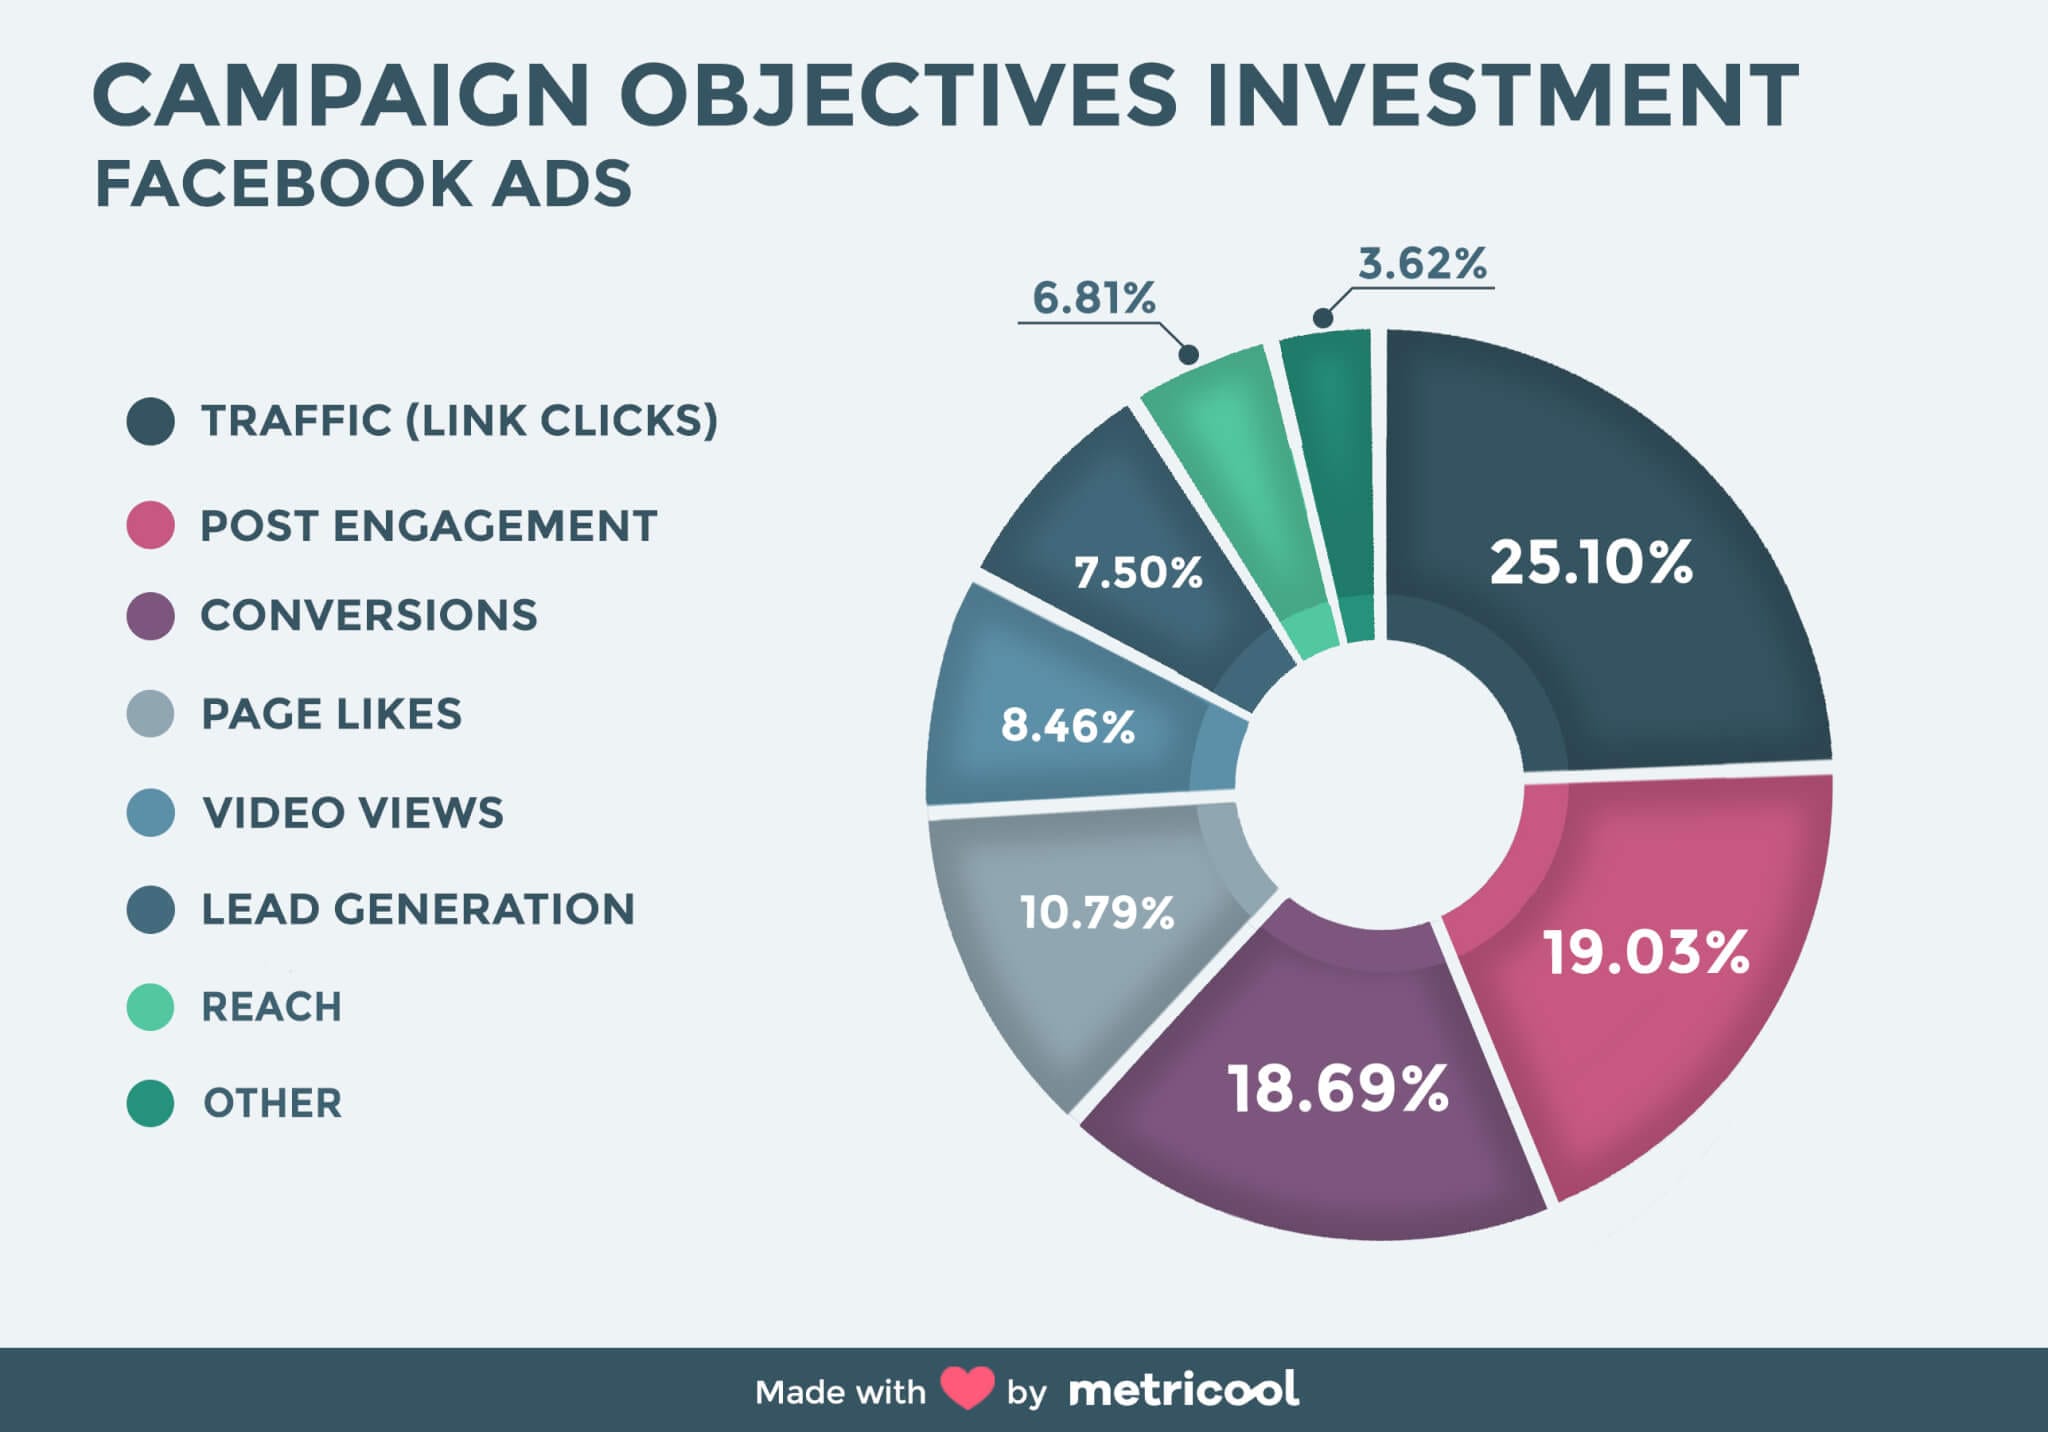
Next, we focused our analysis on the objectives where most of the budget is spent.
In this case, traffic absorbs most of the budget because it’s the objective with the most direct ROI. Particularly when the third objective in the ranking is conversions, that also implies driving traffic to a specific website.
The ranking of investment per ad objective is the following:
- Traffic: 25.10% of the budget
- Post Engagement: 19.03%
- Conversions: 18.69%
- Page Likes: 10.79%
- Video views: 8.46%
- Lead Generation: 7.49%
- Reach: 6.81%.
The rest of the ad objectives have a very little representation below 1% of the total budget.
If we consider the number of campaigns and the amount spent on each objective, we can calculate the average budget for each type of campaign:
- Post Engagement: The average investment in promoting a post is 7.86 USD
- Video views: Brands invest 29.04 USD on average for each video that they’d like to promote.
- Traffic: The average investment is 52.22 USD when the objective is to obtain link clicks.
- Page Likes: The average investment is 52.80 USD for increasing the number of followers.
- Reach: In this ad campaign objective the average investment is 74.26 USD
- Lead Generation: Obtaining data from new leads requires an investment of 137.26 USD per campaign.
- Conversions: Optimizing conversions in a website is the type of campaign that receives the largest investment on average: 188.17 USD.
More information about managing Facebook Ads campaigns with Metricool by clicking here.
Benchmark of your ad campaigns average performance: CPM and CPC
We analyzed the average performance of each campaign objective and we calculated the average cost per thousand impressions (CPM) and the cost per click (CPC).
Cost per thousand impressions or cost per mile (CPM)
In general, the average CPM for all the campaigns considered in our study is 1.26 USD. However, if we look at the performance by type of campaign, we find significant differences. Depending on the objective, Facebook can show your add to a larger audience or a better selected one. If you’d like your ad to be shown to more people, it will cost a bit less.
Example: Promoting a video using the video views objective will be cheaper than promoting a standard publication through the objective of post engagement. You can optimize your budget choosing the right objective for your campaign.
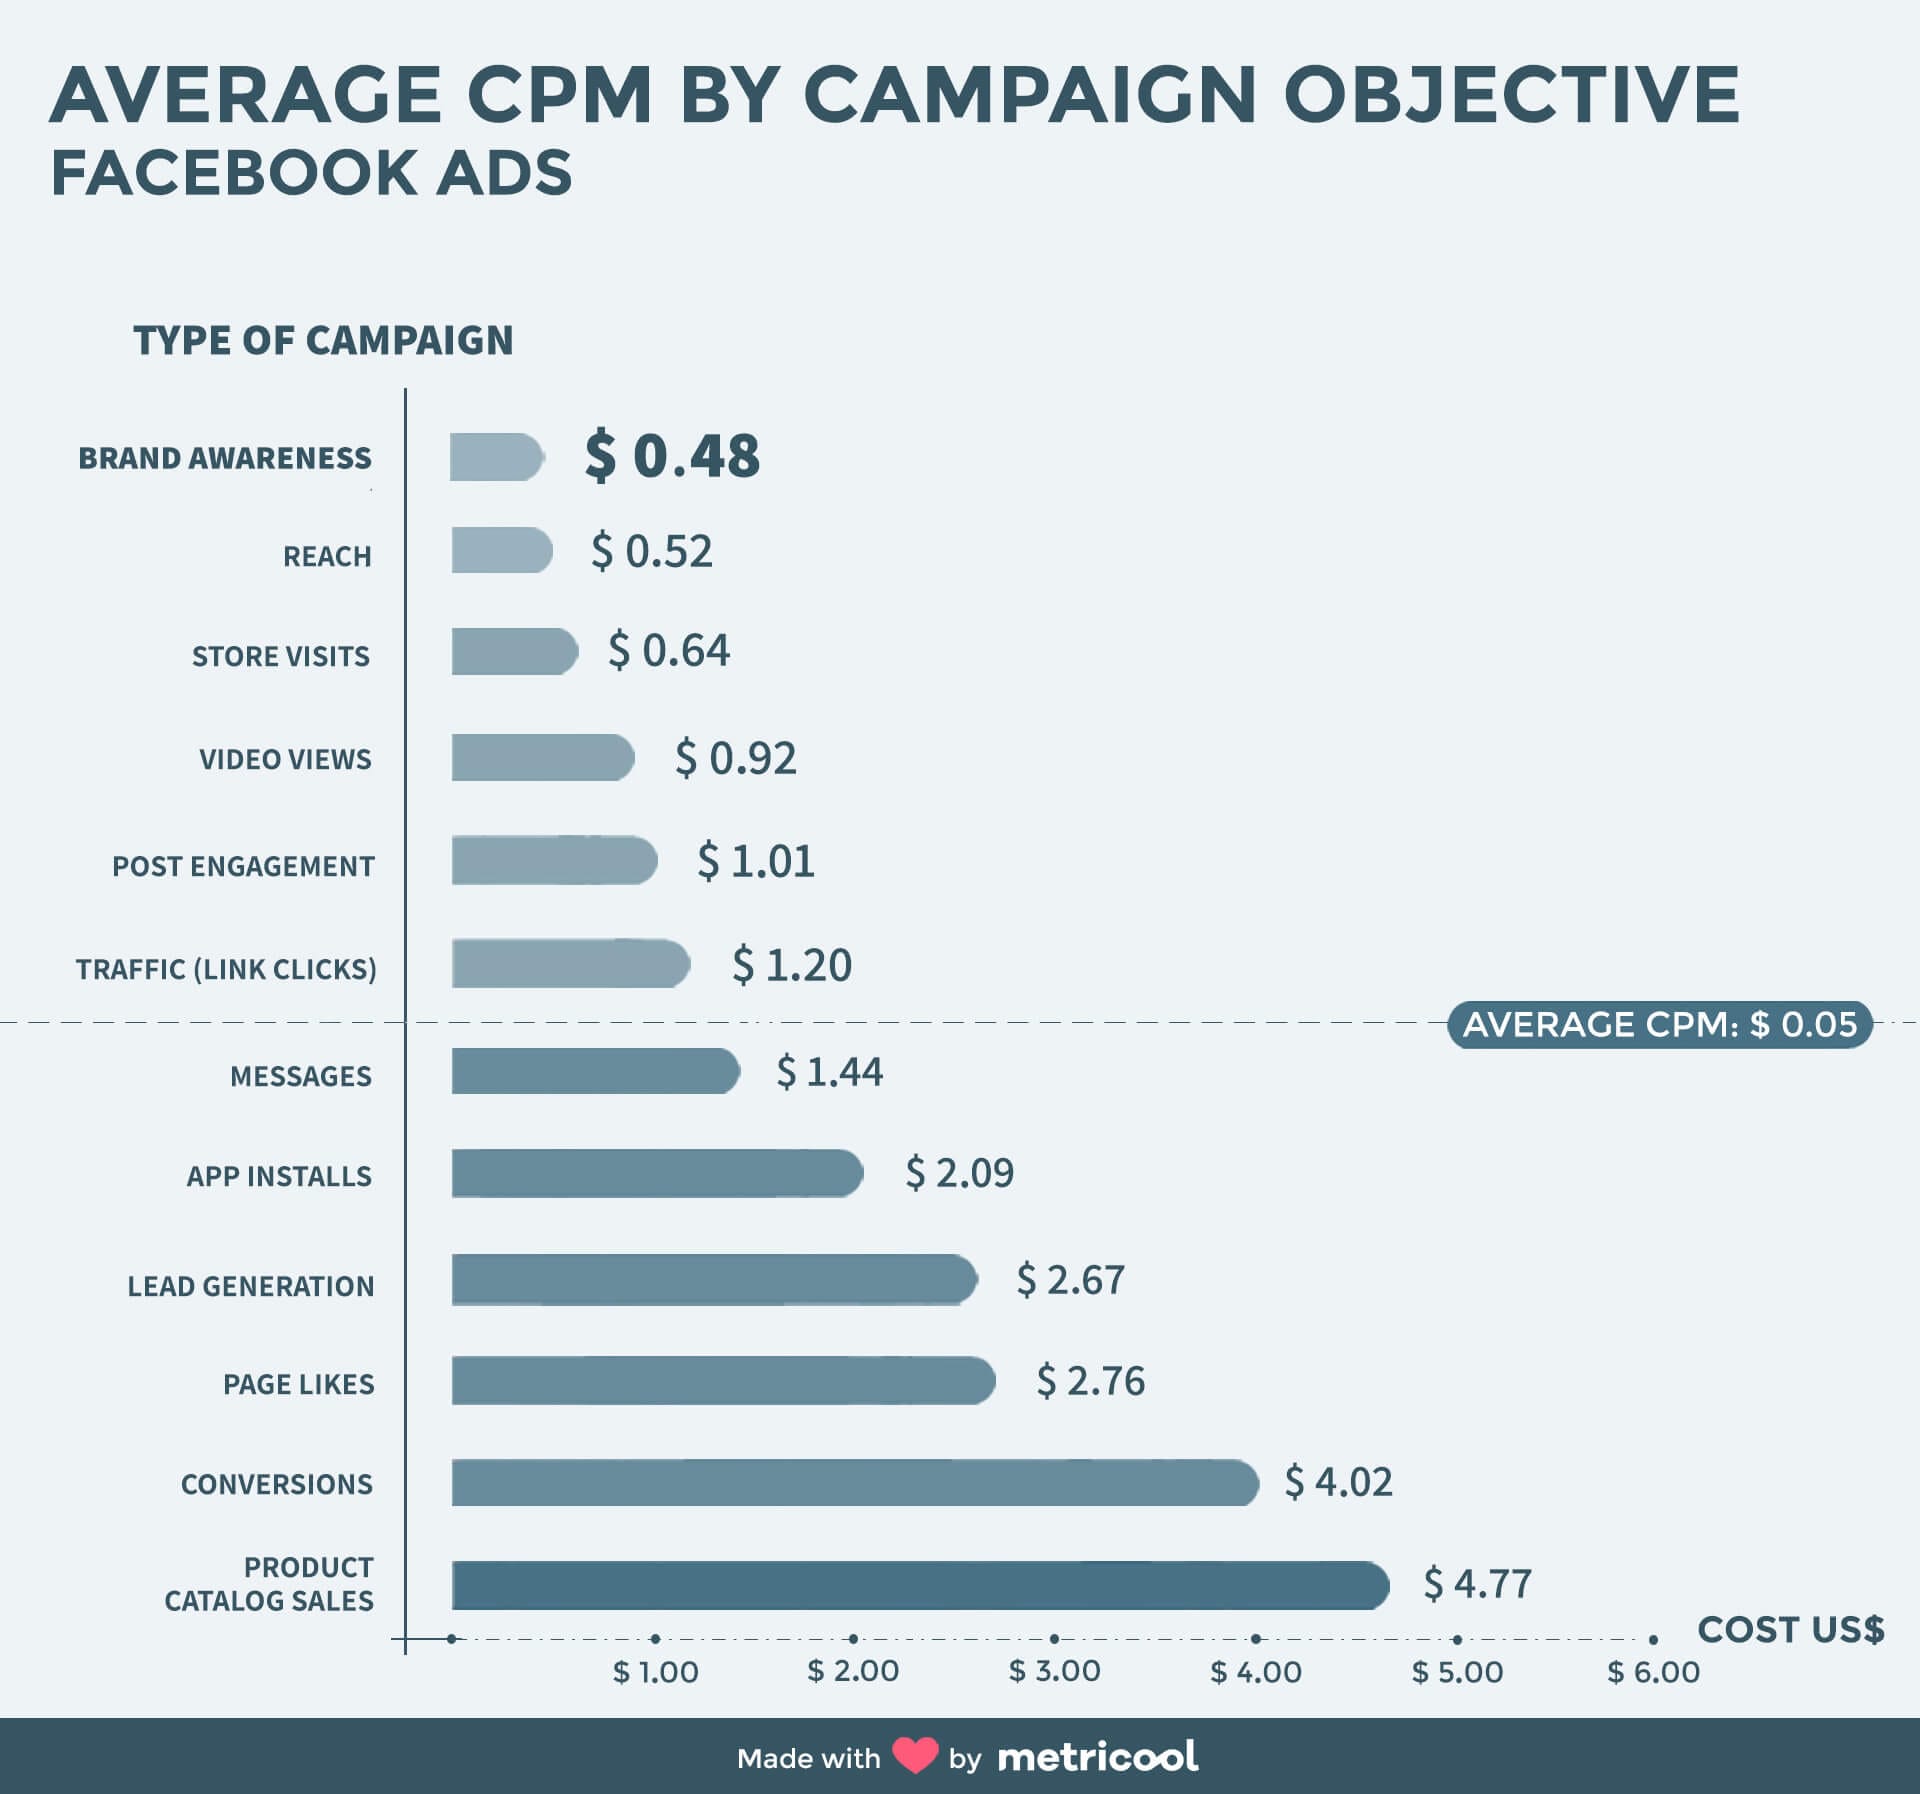
POST ENGAGEMENT VERSUS PAGE LIKES: DIFFERENCES
Promoting your page (page likes) almost triple the cost of boosting your posts (post engagement) in terms of CPM. Besides, when we try to get more interactions, we can include a message in the publication to help us reach our business goals.
BRAND AWARENESS CAMPAIGN HAS THE LOWEST CPM
The cost for brand awareness is 0.48 USD per thousand impressions. However, it’s difficult to make a profit in the short term or obtain an immediate ROI using this objective.
Brands often choose several objectives at the same time: brand awareness, traffic, sales, etc. Knowing the average cost for each ad objective can help to redefine the priorities ande decide where the budget should go.?
TIP
You can save costs when you run a sales catalog campaign if you take advantage of the low cost of the traffic ad objective (link clicks)
Cost per click (CPC)
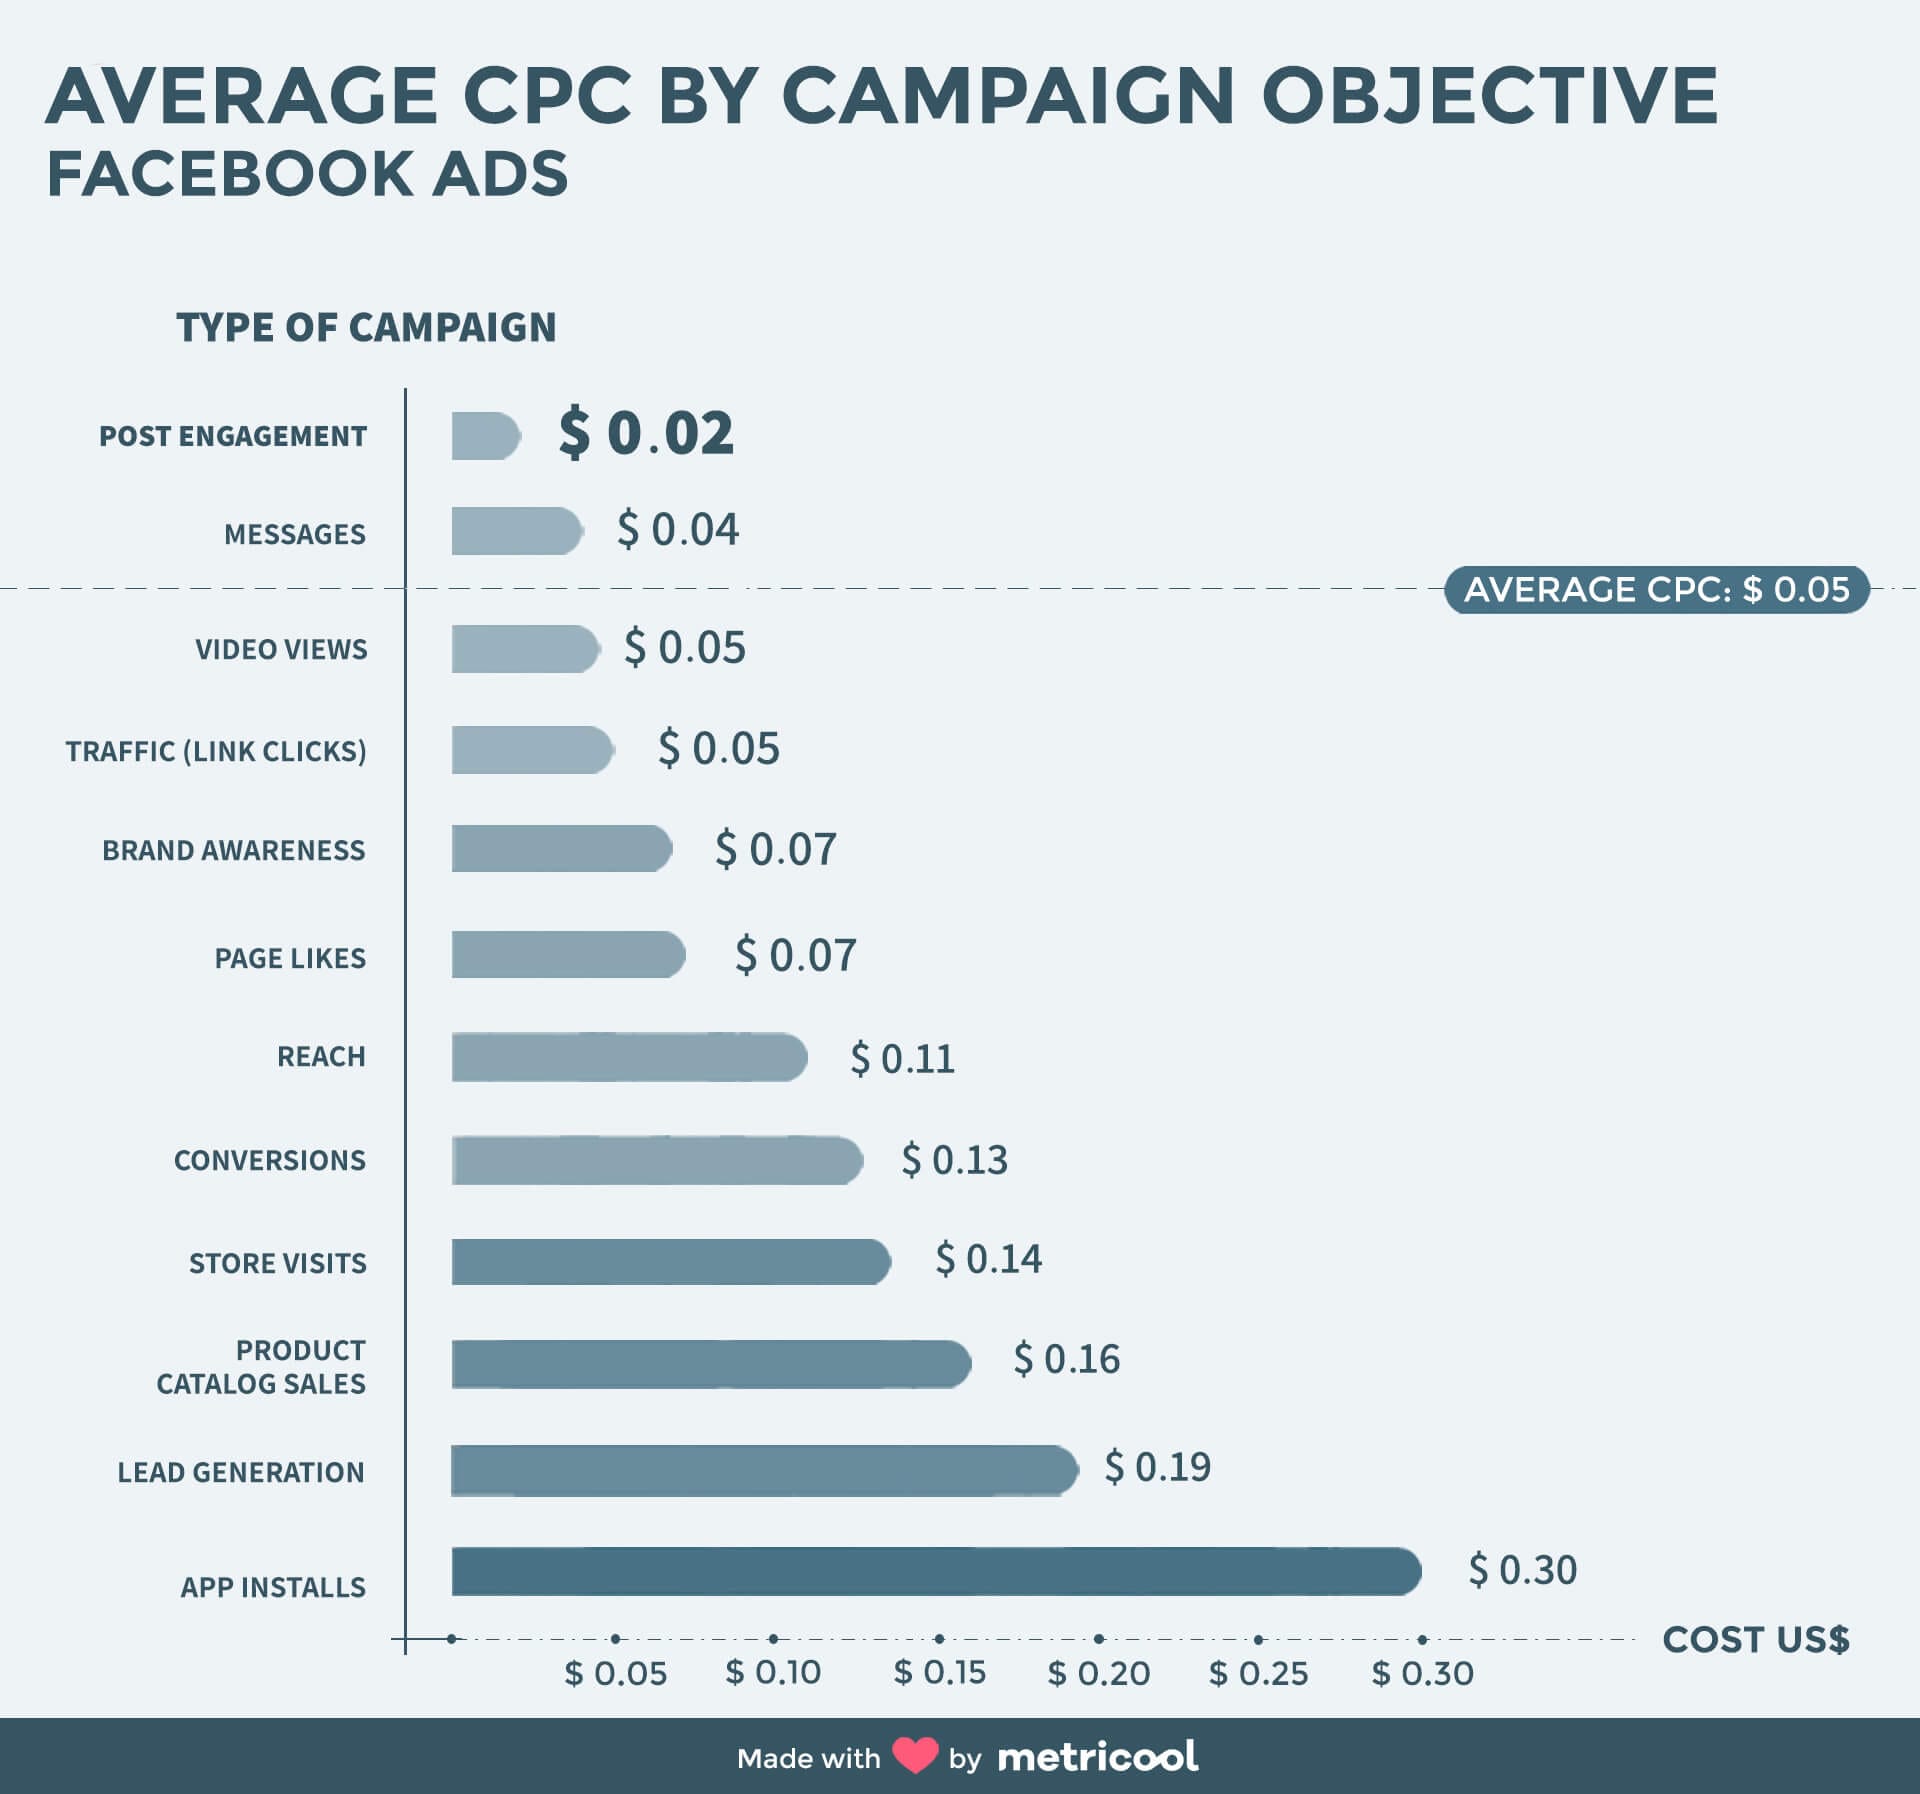
The average CPC of all the campaigns included in this study is 0.05 USD.
Remember that each type of campaign has different costs and performances. Then, we should break down the cost by each ad objective.
As mentioned before, the objective of driving traffic to a specific webpage receives the highest total investment. This demonstrates that the main role for Facebook ads is to take traffic to websites. The objective is often focused on getting more registrations to sell products sooner or for direct sales. However, there are different ways to reach this business goal: We can use a direct ad campaign for the product we’d like to sell or for example, we can buy leads (contact database) for email marketing campaigns.
You can discover which strategy is more profitable when you know the average cost of each ad campaign.
We analyzed the CPC per ad objective and obtained the following data:
- App installs: It’s the most expensive campaign with a cost of 0.30 USD per click.
- Post engagement: 0.02 USD per publication. It’s the cheapest objective to get clicks
These are three very interesting data points extracted from this analysis:
- CPC for lead generation: 0.19 USD
- CPC for conversion: 0.13 USD.
- CPC for traffic (link clicks): 0.05 USD
This means that if you are trying to capture potential customers (leads), it might be better for you to run a traffic campaign, provided that the conversion rate of your landing page is over 25%.
You should analyze which ad campaign is more profitable for your particular case now that we put all of this info together for you.
Campaigns performance by country
We divided the total analyzed campaigns based on the country where they were run.
This split is very interesting because it allows us to establish a benchmark among the different countries.?
TIP
It can sometimes be a good option to exclude some countries from your campaigns when you know the results won’t be as good. However, don’t jump to hasty conclusions:
It might be more expensive to get a costumer in Spain than in Argentina. However, that costumer could spend more money in each purchase or buy more often.
You must optimize your campaigns based on your costumers.
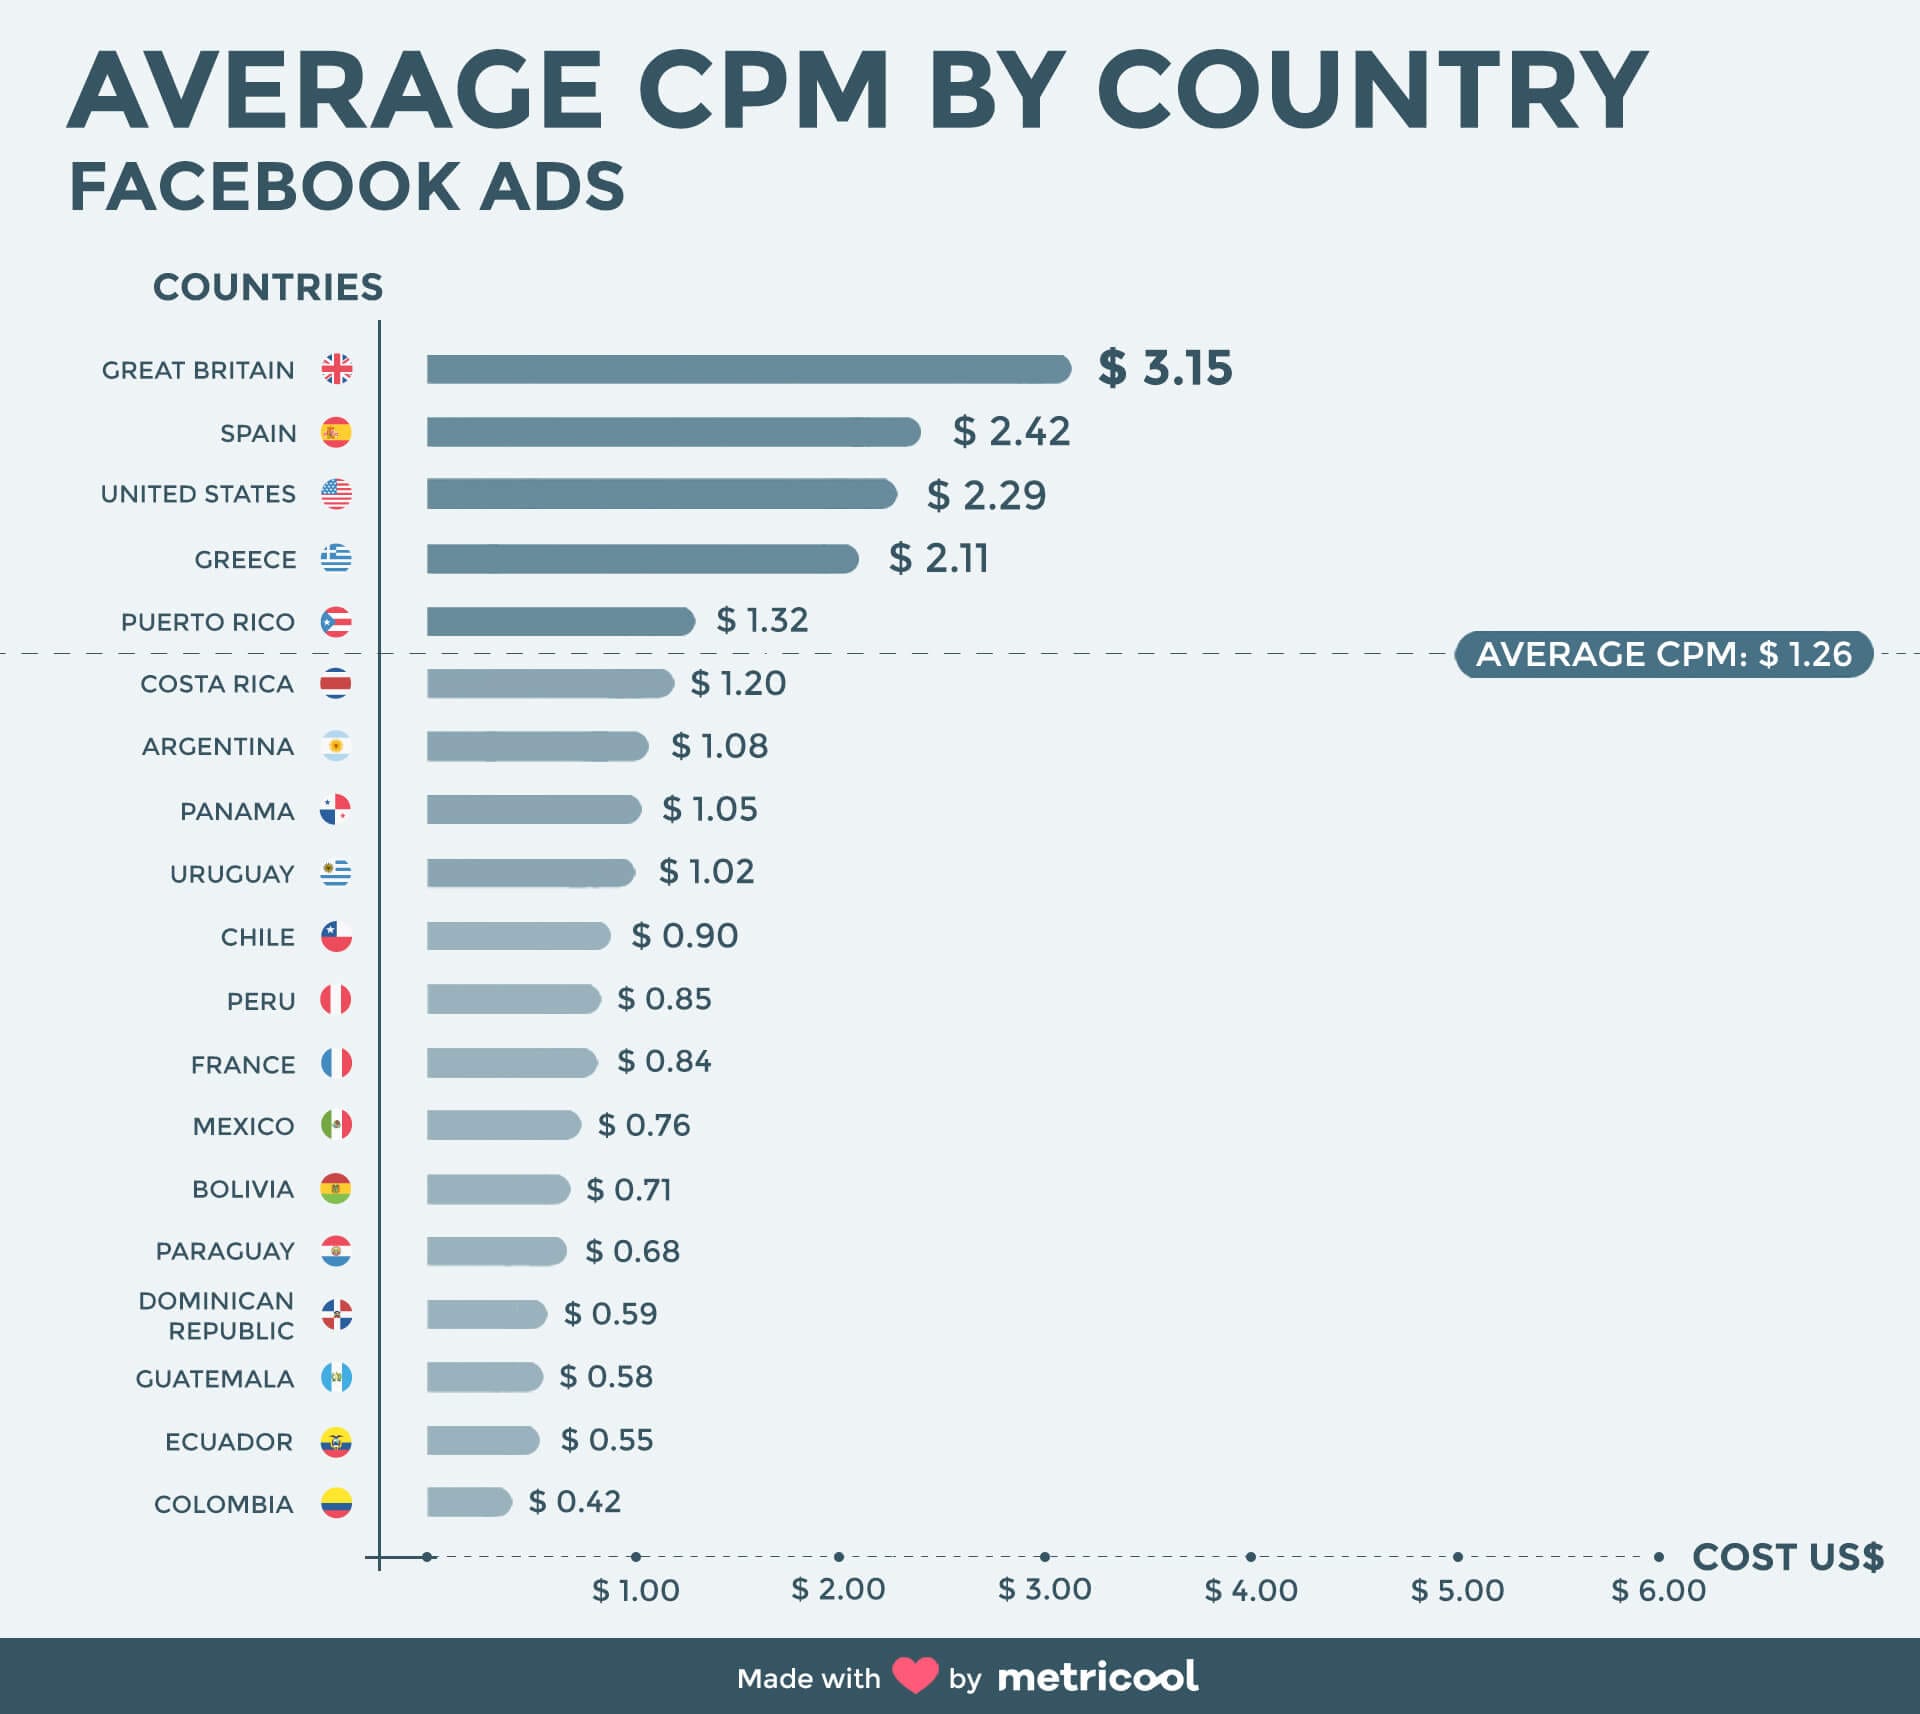
Cost per 1000 impressions (CPM) by country
As we mentioned before, the average CPM of all the analyzed campaigns is 1.26 USD. The cost is above this average in United Kingdom (3.15 USD), Spain (2.42 USD), The United States (2.29 USD), Greece and Puerto Rico.
- The most expensive CPM: United Kingdom is the most expensive country to obtain 1000 impressions with an average cost of 3.15 USD.
- The cheapest CPM: Colombia spends only 0.42 USD on average for 1000 impressions.
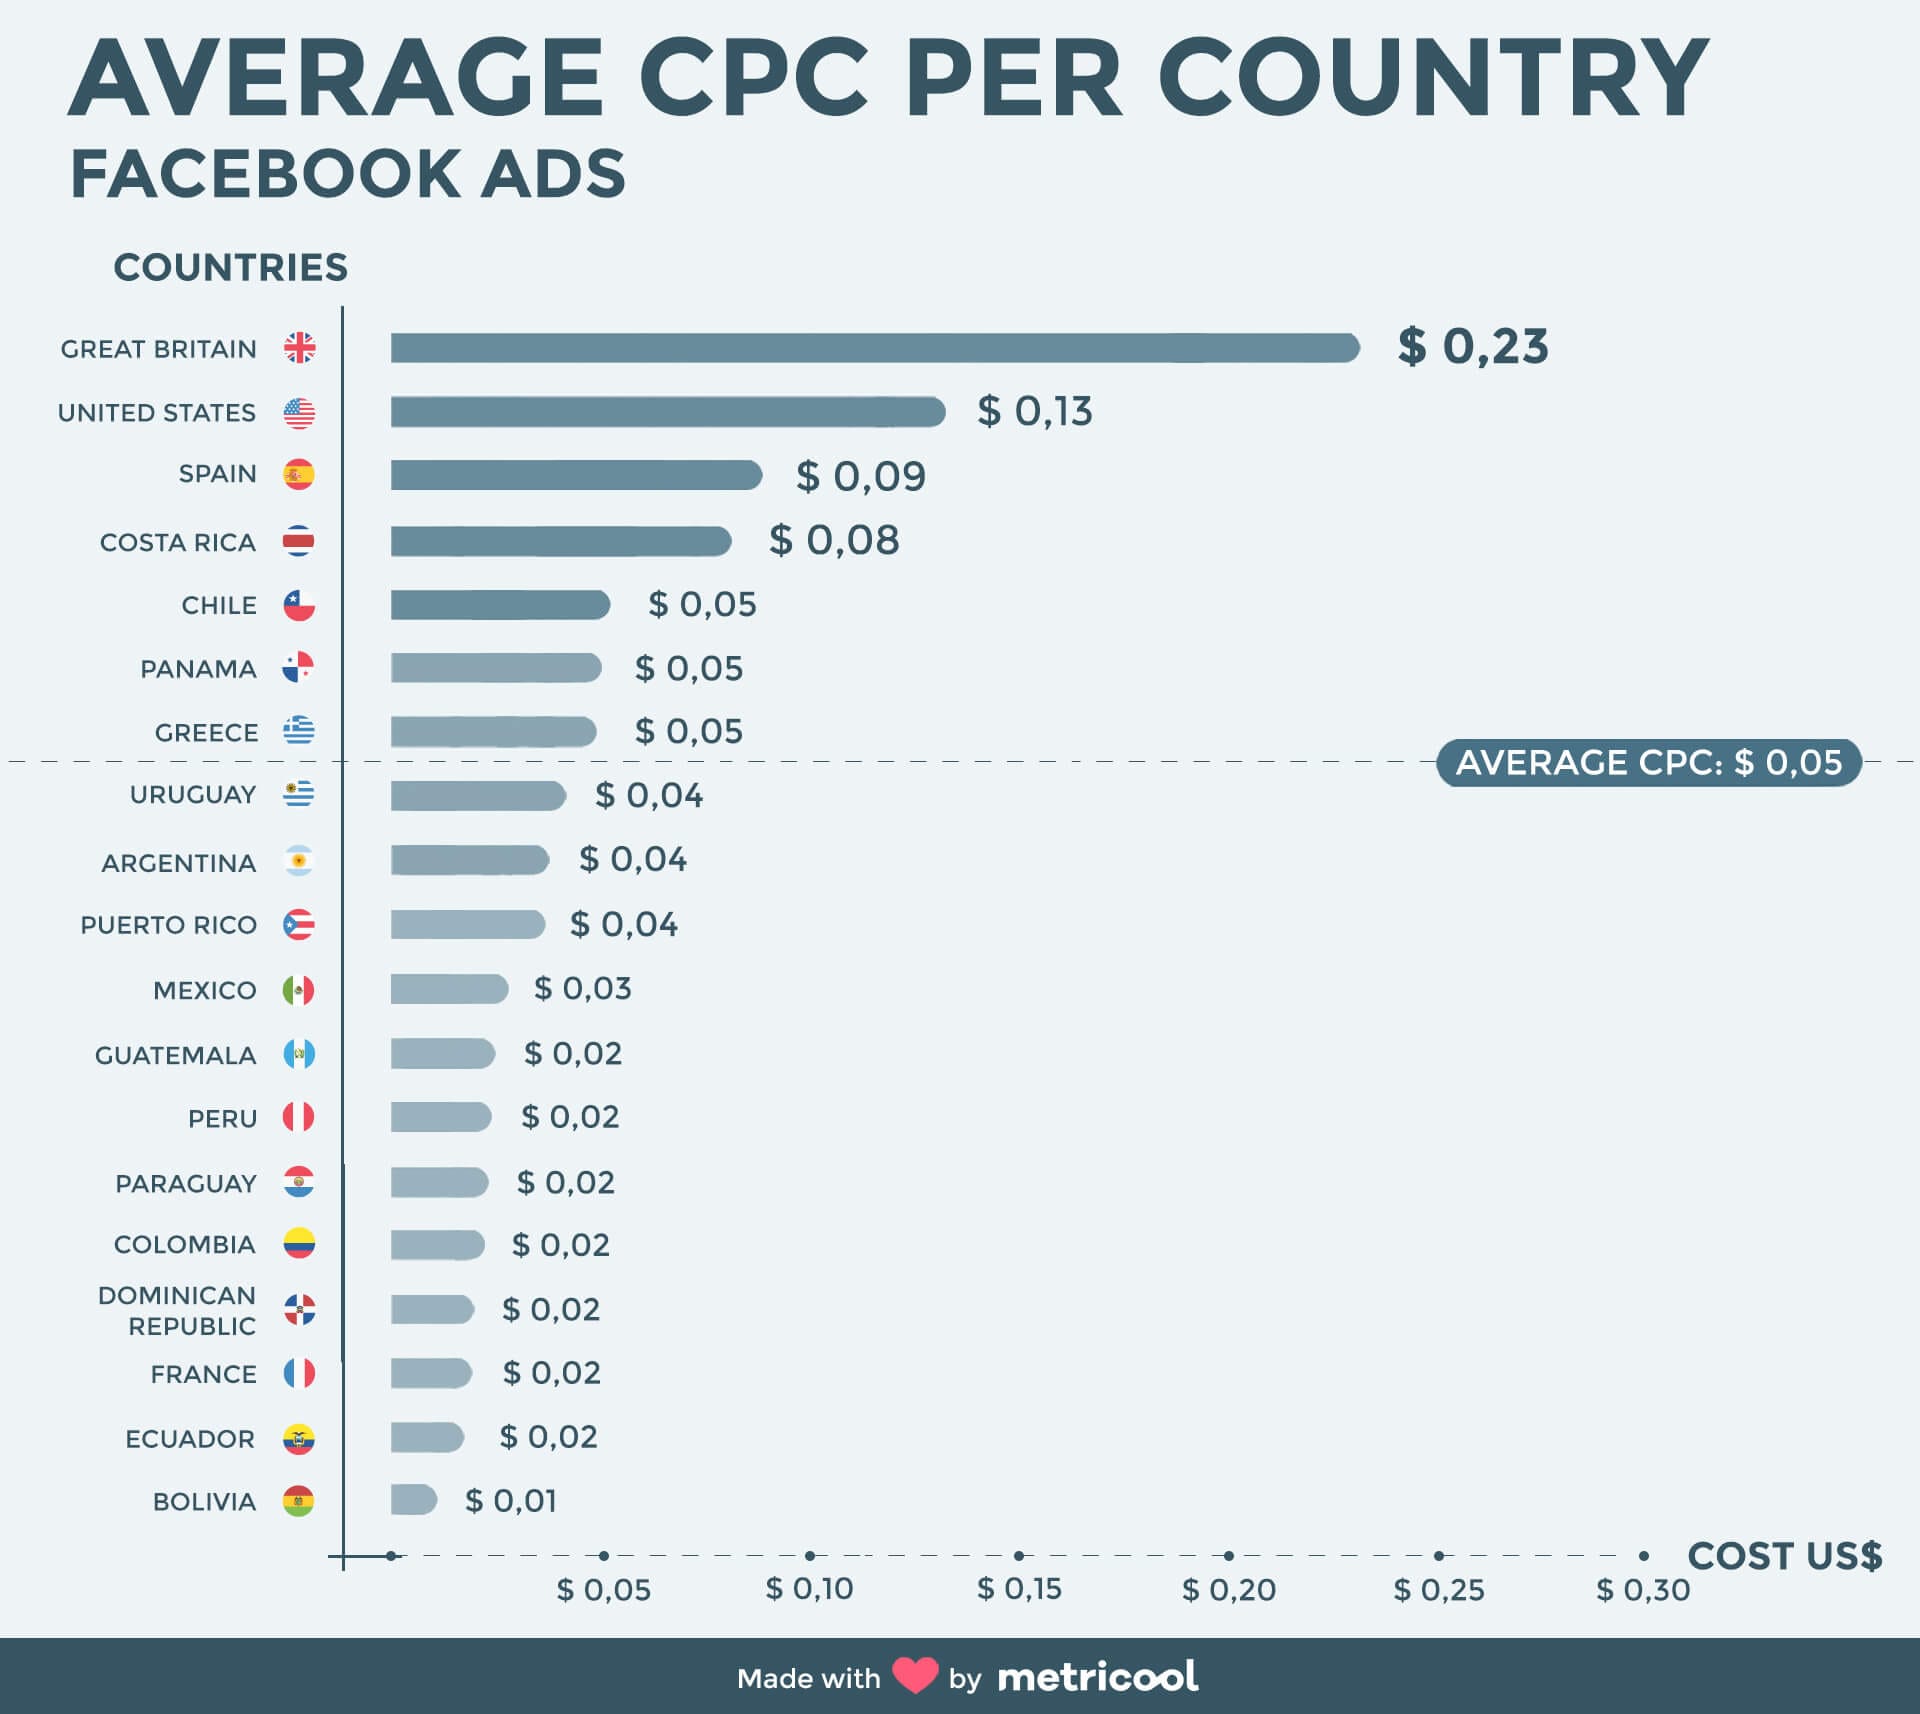
Cost per click (CPC) by country
The average CPC is 0.05 USD. United Kingdom, The United States, Spain and Costa Rica are above this average.
As you can see in the graph, there is a big gap among countries. Therefore, we recommend you separate audiences by countries with similar costs. If you put together very different countries in the same campaign, Facebook will run the ad in the country where is more profitable and you won’t reach your goals in the rest of the countries.
You should also consider the type of costumers that you will get with your campaigns. The type of costumer is more valuable than the amount you spend to get them.
Conclusions from our Facebook ads study
These are the conclusions obtained looking at the numbers in general:
Post Engagement is the most popular campaign objective
Facebook encourages brands to use part of their budget to increase the reach of their posts.
On average, boosting a post costs 7.86 USD, by doing so you will get 7,777 additional impressions.
The average CPM is 1.01 USD.
Look for video views instead of post engagement
If you want to reach a larger audience with your videos, it will be more cost effective if you increase the video views instead of trying to boost your post.
The CPM for video views is almost 10% lower than the ad objective of post engagement.
You don’t have to opt for the conversion objective if you want to get more registrations
The average CPC for traffic (link clicks) is 0.05 USD, 0.13 USD for conversions and 0.19 USD for Lead Generation campaigns.
Check the conversion rate of your registration landing page and optimize your campaign selecting the most profitable objective.
Bear in mind that on average, it’s better to buy 3 clicks on a link than 3 clicks on a lead generation type of campaign.
Businesses prefer visits over branding
Most of the advertising budget of a business goes to traffic, conversion or lead generation.
On the opposite end, we find campaigns like brand awareness or reach.
Brands opt for the type of campaign that generates an immediate return on Investment (ROI) versus campaigns that generate profit in the long term.
Besides, this data indicates that Facebook’s income mostly comes from digital businesses. In contrast with more traditional businesses or larger brands that prefer to invest their budget in other advertising channels, like sport events or traditional ones like TV or newspapers.
Separate countries in different campaigns
There are significant differences in the performance by countries.
We recommend that you avoid putting together very different countries in the same campaign.
If you mix countries with a substantial difference in their CPM or CPC. Facebook will optimize and run your ad in those more cost-effective countries and with lower competition.
It’s also interesting to analyze if costumers in certain countries convert more frequently or are more recurring. It’s pointless to drive more traffic to countries that are cheaper if those customers rarely buy on your type of business.
Example: If customers from Argentina spend 25% more on purchases than people from Mexico, it’d be better to get Argentinian customers than Mexicans. However, if you select both countries in the same campaign, your ad will be shown only to Mexican users because clicks and impressions are more cost-effective in Mexico.?
STUDY TO GET MORE INFORMATION
If you’d like to get more information we recommend you read:
A social Networks study elaborated by Metricool, also based on real data
Did you find this info useful?
Now you can base your campaign on real data.
Tell us if you draw a different conclusion from this study and remember to share this Facebook ads study with others. Knowledge must be shared.