

Like most websites, we use own and third party cookies for analytical purposes and to show you personalised advertising or based on your browsing habits.
Generally, the information does not directly identify you, but can provide you with a more personalised web experience. Because we respect your right to privacy, you may choose not to allow us to use certain cookies. However, blocking some types of cookies may affect your experience on the site and the services we can offer.
For more information, you can read our cookie policy.
Your Metrics on Metricool
Metricool offers many metrics for multiple digital platforms. If you connect your accounts, you can find valuable insights for:
- Web/blog
- TikTok
- Twitch
- YouTube
- Google My Business
- Facebook Ads
- Google Ads
- TikTok Ads
In this article we will review all the metrics related to your accounts in detail that you will find on Metricool and what they mean.
Metrics
Brand Summary
A summary of all the social media accounts connected to Metricool as a whole: a summary with all the metrics and individually sorted from highest to lowest.
What metrics will you find in this section?
- Account: number of followers and impressions.
- Posts: interactions, number of posts and list of posts.
- Ad accounts: impressions, clicks and performance (CPM).
Website
✅ Web analytics
- Page Views: Number of page views of our web in the time span selected.
- Visits: The number of times our web has been visited. (“Sessions” on Google Analytics)
- Visitors: Number of unique users who have visited your site.
- Posts: Total number of posts published in the period of time selected.
- Comments: Total number of comments received in the posts published in the time frame selected.
- Daily page views, visits and visitors: Average between the total data and the time range selected.
- Page views per visitor.
- Posts per week.
- Comments per post.
✅ Post List
- Date: It indicates when the post has been published.
- Comments: Number of comments received by each post.
- Facebook: Number of times each post has been shared on Facebook.
- Twitter: Number of times each post has been shared on Twitter.
- Total Shares: Total number of times the post has been shared.
- Pageviews: Number of times that each post has been viewed in the period selected.
- Total Pageviews: Number of times that each post has been viewed since it was published.
✅ Location
- Visitor countries: List of countries from where your visitors have access to your web. The data is expressed in absolute value and percentage.
By clicking on the arrow to the right of each country, you access to:
- Region: Breakdown of regions in that country.
- Visitors: Number of unique users who have visited our website expressed in absolute values and percentage.
✅ Traffic
- Page Views: List of the pages that have been visited on your website organized in descending order. Expressed in number and percentage of the total visits received by the website in the period of time selected.
- Traffic Source: List with the different kind of sources that send traffic to your Website. In number and percentage. Organized in descending order.
By clicking on the arrow to the right of each traffic source, you access to:
- Source: Breakdown of each traffic source
- Visitors: Number of unique users who have visited our website expressed in absolute values and percentage
Twitter evolution page is divided by Community, Posts and Competitors. Following, you can check all the related metrics one by one:
Community
✅ Growth
- Followers: Total number of followers at the end of the period selected.
- Following: Total number of users that are followed by us.
- Second Level: Followers of our followers, that is, our potential followers.
- Tweets: Number of tweets that we have published in the time range selected. It includes original tweets, retweets and replies.
- Followers (Variance): The growth of followers in the period selected.
- Daily followers: Average number of followers earned or lost per day in the period of time selected.
- Followers per tweet, Following, Daily tweets, Weekly tweets: Average data in the period of time selected.
*If you hover over the arrow icon next to the numbers, it will show you the variation of the current period with respect to the previous exact period. For example, if you select a week, the result will compare to the previous 7 days.
✅ Balance of followers
It records all the follower changes that occurred in the time span selected. If a new follower stops following us and then starts following us again on different days, it will count as 2 followers. This includes deleted or restricted accounts.
The Follower Balance is meant to analyze the reaction of our community to our publications and to see which days we gain or lose the most followers.
- Acquired: Followers earned in the period selected. If there are accounts that have been blocked or have been deleted in the period, they won’t appear in the dashboard but they will be displayed in the report.
- Lost: Followers lost in the period selected.
- Tweets: Number of total tweets published in the period selected. It includes tweets, retweets and replies.
✅ Acquisition
A list with the followers acquired or lost during the time range selected. It is organized from the most recent to the oldest.
✅ Mentions
Mentions: Total mentions received in the period selected. Metricool counts every time someone replies to a tweet and when there is a explicit mention with the @ symbol.
Tweets: Number of total tweets published in the period selected. It includes tweets, retweets and replies.
Tweets
✅ Summary
- Engagement: Number of interactions received per 1000 impressions. Interactions/Impressions x 1000.
- Impressions: Number of times tweets have been displayed. (organic and promoted data)
- Interactions: Number of interactions received by the tweets published in the period selected: Likes, retweets, replies, quotes, link clicks and profile clicks. (organic + paid data)
- Tweets: Number of total tweets published in the period selected.
✅ Interactions
- Likes: Total number of likes received on your tweets published in the period selected.
- Retweets: How many times your posts published in the period selected have been retweeted.
- Replies: How many times your posts have been replied to.
- Quotes: How many times a tweet has been retweeted with a comment added.
- Profile clicks: The number of times a user clicks on the following parts of a tweet; display name, user name, profile picture.
- Link clicks: number of times a user clicks on a URL link or a URL preview card in a Tweet.
- Tweets: Number of total tweets published in the period selected.
- Daily likes, Likes per tweet, Daily retweets and Retweets per tweet: Average data in the period of time selected.
✅ Type of Tweets
- Number of tweet types you have published in the chosen period: Original tweets, retweets and replies. The information is displayed in a chart or table.
- Impressions: organic and promoted impressions of our publications. The information is displayed in a chart or table.
✅ List of Tweets
- Date: Tweet publication date.
- Impressions: Total number of tweet impressions. Below the data you can see a bar indicating the organic and promoted data.
- Likes: Total number of likes received by tweet. Below the data you can see a bar indicating the organic and promoted data.
- Retweets: How many times each tweet has been retweeted. Below the data you can see a bar indicating the organic and promoted data.
- Replies: How many times a tweet has been replied to. Below the data you can see a bar indicating the organic and promoted data.
- Quotes: How many times a tweet has been retweeted with a comment added.
- Link Clicks: number of times a user clicks on a URL link or a URL preview card in a Tweet. Below the data you can see a bar indicating the organic and promoted data.
- Profile Clicks: The number of times a user clicks on the following parts of a tweet; display name, user name, profile picture. Below the data you can see a bar indicating the organic and promoted data.
- Engagement: Interactions/Impressions x 1000
- Video views: How many times the video included in the tweet has been viewed. A view is considered when the video has been watched for at least 2 seconds and has been viewed on at least 50% of the screen.
Competitors
✅ Summary
- Followers: Total number of followers of each competitor.
- Following: Total number of users that are followed by each competitor.
- Tweets: Number of total tweets published in the period selected
- Likes: Average number of likes received by tweets published in the time range selected.
- Retweets: Average number of times each tweet published in the period selected has been retweeted.
- Engagement: Total number of interactions received per 1000 impressions: Interactions/Impressions x 1000.
✅ More Stats
- Growth: Evolution of followers, following and tweets in the period selected.
- Interactions: Total number of likes and how many times posts have been retweeted along with an evolution chart. Number of tweets published in the period selected.
- List of tweets: A list with all the posts published in the period selected along with the number of likes and retweets received by each publication.
Page Overview
✅ Growth
- Likes: Total number of page likes received at the end of the period selected.
- Followers: Total number of followers received at the end of the period selected.
- Impressions : Total number of impressions on your page, including impressions on posts in the period selected (organic and paid data).
- Page Visits: Number of times your Fan Page has been viewed.
- Posts: Number of publications in the period selected.
- Likes (variance): Likes growth in the period selected.
- Daily likes, Daily page views and Daily posts: Average between the total data and the time range selected.
- Likes per post.
- Posts per week.
* If you hover over the arrow icon next to the numbers, it will show you the variation of the current period with respect to the previous period. For example, if you select a week, the result will compare to the previous 7 days.
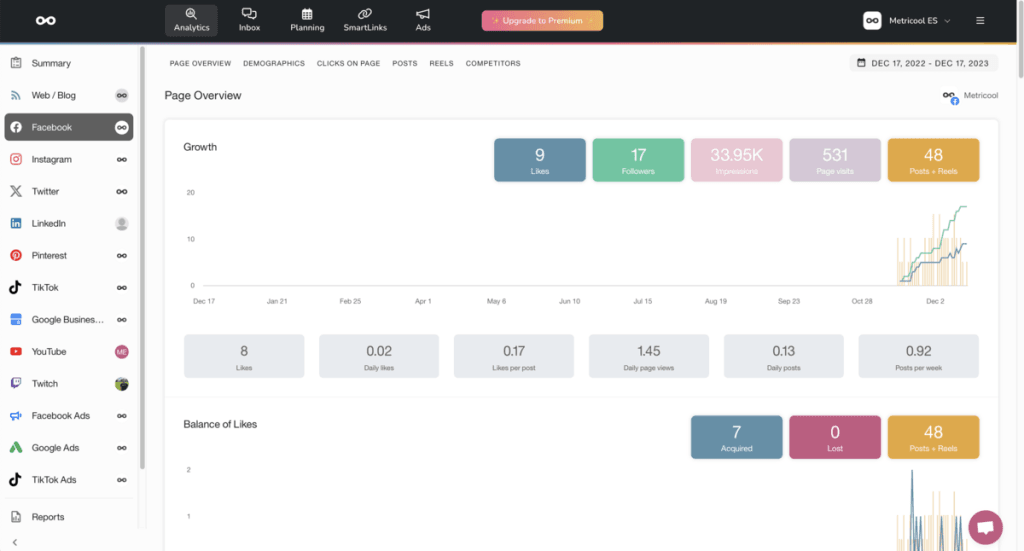
✅ Balance of Likes
It records all the follower changes that occurred in the time span selected. If a new follower stops following us and then starts following us again on different days, it will count as 2 followers. Likes from deleted or restricted accounts are also included.
This metric is meant to analyze the reaction of our community to our publications and see which days we have achieved the most likes.
- Acquired: Followers acquired in the period selected.
- Lost: Followers lost in the period selected.
- Posts: Total number of publications in the period selected.
✅ Demographics
Gender, Age, followers by country and city. Facebook will start providing this information from 100 followers.
✅ Clicks on page
- Call to Action: Number of clicks on the call-to-action button located at the top of the Page (Register, call, write, donate, etc. depending on how it is configured).
- Website Button: Number of clicks on the link to our website within the Facebook page.
- Page Visits: Number of visits to our Facebook page.
- Posts: Number of posts published in the period selected.
Posts
✅ Overview
- Engagement: Engagement of our publications. The engagement rate is the number of interactions per 1000 people reached. Depending on each social platform, this formula varies slightly.
- Interactions: Total number of interactions that our posts published in the period selected have received. That is, reactions, shares, clicks and comments.
- Avg. reach per post: Average number of people reached by our publications. The average is calculated by the number of posts. It includes both organic and paid data (except for other type of promotions, such as ads)
- Impressions: Total number of times that our publications have been displayed. It adds up organic and paid data.
- Posts: Total number of publications in the period selected.
✅ Interactions
- Reactions: Total number of reactions towards the posts published in the period selected. (Like, Love, Haha, Wow, Sad and Angry)
- Comments: Total number of comments on posts published in the time range selected.
- Shared: How many times our posts published in the period selected have been shared.
- Clicks: How many times our posts have been clicked.
- Posts: Posts published in the period selected.
Daily Reactions, Reactions per post, Daily Comments, Comments per post, Shares per day and Shares per post: average between the data and the selected time range.
✅ Types
You can see as a graph or as a table whether interactions have been made on links, images or videos in your posts.
✅ Impressions
This graph shows you organic and promoted impressions. You can also view it as a table
✅ List of posts
- Type: Type of post: with link only, with video or with image.
- Date: Publication date.
- Reactions: Total number of reactions received by each post: Like, Love, Haha, Wow, Sad and Angry. It includes organic, paid and viral. By viral, we mean the reactions received when other users share our post.
- Comments: Total number of comments on each publication. Includes paid and viral content.
- Shares: Number of times that the publication has been shared.
- Clicks: Total number of clicks on each publication.
- Link Clicks: Clicks on the link included in each publication.
- Impressions: How many times your publications have been displayed. It considers the organic and paid data.
- Reach: Number of people who have been reached on each publication. It considers the organic and paid data.
- Video views: The number of times your video was watched for at least 3 seconds, or for nearly its total length, whichever happened first. During a single instance of a video playing, we’ll exclude replays.
- Video time watched: Average time videos have been played.
- Engagement: Engagement of our publications. The engagement rate is the number of interactions per 1000 people reached. Depending on each social platform, this formula varies slightly.
- Spent: if the post is promoted, total spent incurred.
Competitors
✅ List of competitors
- Likes: Total number of likes on the the competitor’s page.
- Posts: Total number of publications in the period selected
- Reactions: Average number of reactions on all the posts published in the period selected.
- Comments: Average number of comments on posts published by the competitors in the period of time selected.
- Shares: Average number of times our competitor’s posts have been shared in the time range previously selected.
- Engagement: The engagement formula for competitors is as follows: Avg. Interactions (reactions, shares, comments)/ # followers * 1000
✅ More Stats
- Growth: Followers evolution along with the evolution of publications in the time span selected
- Interactions: Reactions, comments, shared and posts evolution.
- Posts: List with all the posts published in the period selected with the following information: date, reactions, comments, shares and engagement.
Facebook Ads
Account
✅ Reach
- Impressions: Total number of times that the ad has been displayed
- Reach: Total number of people who has been reached with our ads.
- Spent: Total spent incurred on Facebook ads in the time frame selected.
✅ Results
- Clicks: Total number of clicks on ads.
- Spent: Total spent incurred on Facebook ads in the time frame selected.
✅ Performance
- CPM: Cost per 1,000 impressions. The formula to calculate is: Spent/Impressions x 1000.
- CPC: Cost per click. The formula is: Spent / Clicks.
- CTR: Click Through Rate. The formula is: Clicks / Impressions x 100.
- Spent: Total spent incurred on Facebook ads in the time frame selected.
✅ Revenue
- Conversion value: revenue we have obtained from the sales of our product on our website. As it is an event that takes place on our side (our website), it is important that we allow Facebook and Google to measure it, otherwise we will not be able to obtain this data.
- ROAS: (Revenue on Ads Spent) tells us how much each euro invested in the campaign has generated. In this way we can compare campaigns with different investments to see which is more profitable. The calculation of this metric is: Conversion value / Expenditure.
Campaigns
✅ List of campaigns
- Updated: Date of the last update of each campaign.
- Impressions: Number of impressions of each campaign.
- Reach: Total reach of each campaign.
- Clicks: Number of clicks on each campaign.
- Conversions: Total number of conversions of each campaign (the conversion is determined by Facebook pixel configuration).
- Results: Total number of actions achieved, in reference to the objective of each campaign.
- CPM: Cost per thousand impressions. The formula to calculate is: Spent/Impressions x 1000.
- CPC: Cost per click. The formula is: Spent / Clicks.
- CTR: Click Through Rate. The formula is Clicks / Impressions x 100.
- Conversion value: revenue we have obtained from the sales of our product on our website. As it is an event that takes place on our side (our website), it is important that we allow Facebook and Google to measure it, otherwise we will not be able to obtain this data.
- ROAS: (Revenue on Ads Spent) tells us how much each euro invested in the campaign has generated. In this way we can compare campaigns with different investments to see which is more profitable. The calculation of this metric is: Conversion value / Expenditure.
- Spent: Total spent incurred on each campaign in the time frame selected.
Community
✅ Growth
- Followers: Total number of followers at the end of the period selected.
- Following: Total number of users followed
- Posts: Total number of posts published in the period selected.
- Followers (variation): Total number of followers gained or lost in the time frame selected.
- Daily followers: Average number of followers gained or lost in the period of time analyzed.
- Followers per post: Average number of followers gained or lost per post published in the period selected.
- Following (variation): The increment or decrease of people followed in the period selected.
- Daily and weekly posts: Average of posts published in the time frame selected.
* If you hover over the arrow icon next to the numbers, it will show you the variation of the current period with respect to the previous period. For example, if you select a week, the result will compare to the previous 7 days.
✅ Balance of Followers
The Followers balance records data on all the movements of our followers. If a follower for example unfollows us and then follows us again, it would count as two followers. Movements of deleted or restricted accounts are also included.
✅ Demographics
Gender, Age, followers by country and city. Instagram will start providing this information from 100 followers. You can see the information as a chart or a table.
Account
✅ Profile
- Impressions: Total number of times that the profile or publications are shown. It includes organic and paid data.
- Avg. reach per day: Average number of people who have been reached with our publications. The average is taken over the number of days. It includes organic and paid data.
- Profile views: Visits to Instagram profile.
- Website clicks: Number of clicks on the Bio’s URL.
- Posts: Total number of posts published in the period selected.
Posts
✅ Organic Summary
- Engagement: Engagement of our publications. The engagement rate is the number of interactions per 1000 people reached. Depending on each social platform, this formula varies slightly.
- Interactions: Total number of interactions on the posts published in the time span selected.
- Avg. reach per post: Average number of people reached by our publications. The average is calculated by the number of posts. If we want to access the paid data we must connect Facebook Ads to Metricool and check the information about Instagram campaigns.
- Impressions: Total number of times that publications are shown. It only collects organic data. If we want to access the paid data we must connect Facebook Ads to Metricool and check the information about Instagram campaigns.
- Posts: Total number of posts published in the period selected.
✅ Organic Interactions
- Likes: Total number of likes on posts published in the period selected.
- Comments: Total number of comments on posts published in the period selected.
- Saved: Total number of times that post published in the period selected have been saved.
- Posts: total number of posts published in the time frame selected.
- Daily likes, likes per post, daily comments, comments per post, likes per comment.
✅ Types
- Data on the type of publication: image, carousel or video. It is possible to view it as a graph or as a table.
- Impressions: data on organic and promoted impressions of our publications.
✅ List of posts
- Type: type of publication: image, carousel or video.
- Date: Date of post publication
- Impressions: Total number of times that posts has been shown. Below the data you can see a bar indicating organic and promoted impressions.
- Organic Reach: Total number of people that have been reached by each publication organically.
- Paid reach: Total number of people reached with each publication through promoted posts.
- Organic Likes: Total number of likes received organically of each post published in the period selected.
- Organic Saved: Number of times that each post published in the period selected has been saved organically.
- Organic Comments: Total number of organic comments on each publication.
- Organic Clicks: Total number of organic clicks on each publication. This click refers to the link in the BIO.
- Organic Interactions: Total of organic interactions on each publications. (Likes, comments and Saved)
- Paid interactions: total paid interactions for each publication. This data is provided directly by Facebook Ads from the campaign.
- Engagement: Engagement of our publications. The engagement rate is the number of interactions per 1000 people reached. Depending on each social platform, this formula varies slightly.
- Video views: Total number of views of the video. Below the data you can see a bar indicating organic and promoted data. It is counted as a view from 3 seconds onwards.
- Paid Post Clicks: total number of clicks on any part of the paid post.
* To see the paid data, you need to connect Facebook Ads to the brand.
✅ List of hashtags
- Impressions: Number of impressions of a post that includes a hashtag. If the hashtag has been included in multiple posts, those numbers will be averaged.
- Number of posts: Number of posts that include each hashtag.
- Likes: Likes on publications that used each hashtag. If the hashtags have been included in several posts, the numbers will be averaged.
- Comments: Number of comments on publications that used each hashtag. If they have been used in several publications, the numbers will be averaged.
Reels
✅ Organic Summary
- Engagement: Engagement of each publication. This is organic data. Engagement is defined as interactions received per 1000 people reached.
- Interactions: total organic interactions for the period. It includes Likes, Comments and Saves.
- Avg. Reach per Reel: Average number of people reached with our Reels. The average is calculated by the number of Reels. It is organic data.
- Video views: total number of video views for the periodo.
- Reels: total number of Reels in the selected period.
✅ Organic Interactions
- Likes: total number of Likes on the Reels in the selected period.
- Comments: total number of Comments on the Reels in the period.
- Saved: total number of times our Reels have been saved in the period.
- Reels: total number of Reels in the selected period.
✅ List of reels
- Video views: total number of times the video has been viewed.
- Organic Reach: organic reach of the video.
- Paid Reach: paid reach of the reel (TikTok Business accounts only).
- Organic Likes: organic likes of the video.
- Organic Saved: total number of times the video has been saved organically.
- Organic Comments: total number of organic comments the video has received.
- Organic Interactions: organic interactions of the video. Sum of likes, comments and organic saves.
- Paid Interactions: total number of paid interactions of the video (TikTok Business accounts only).
- Engagement: Engagement achieved by the Reel. The engagement ratio is the interactions received per 1000 followers.
- Paid Post Clicks: total paid clicks achieved on a promoted post.
Stories
✅ Evolution
- Impressions: Number of times that stories are shown.
- Avg. reach per story: Average number of people reached per story.
- Stories: Total number of stories published in the period selected.
✅ List of Stories
- Date: Date of story publication.
- Impressions: Total number of times that stories has been shown. Below the data you can see a bar indicating organic and promoted impressions.
- Organic Reach: Total number of people who have been reached by each story. Organic data.
- Paid Reach: Total number of unique people who have been reached by the story. Paid data.
- Organic Replies: Number of replies on each story. It does not include reactions.
- Organic Taps back: Number of times that users have tapped back to see a story again.
- Organic Taps forward: Number of times that users have tapped forward to skip a story.
- Organic Exits: Number of times that users have gone to the next account without seeing all our stories.
* To see the paid data, you need to connect Facebook Ads to the brand.
Competitors
✅ List of competitors
- Followers: Total number of followers.
- Posts: Total number of posts published by each competitor.
- Reels: Total number of competitor’s Reels in the time rage selected.
- Likes: Average number of likes per post.
- Comments: Average number of comments per post.
- Engagement: The engagement formula for competitors is as follows: Avg. Interactions/ # followers * 1000
✅ More stats
- Growth: Total number of followers, posts and Reels published by each competitor.
- Organic Interactions: Total Engagement (Total Interactions/ Followers * 1000), likes, comments and posts in the period selected.
- Posts: List of posts published by each competitor in the time frame selected. Date, total number of likes, comments, interactions and engagement.
- Reels: Engagement, organic likes, organic comments and list of competitor’s Reels.
- Hashtags: Hashtags used by each competitors in the period selected. Number of posts that include each hashtag. Likes on posts that used each hashtag. If the hashtags have been included in several posts, the numbers will be averaged. Comments: Number of comments on posts that used each hashtag. If they have been used in several posts, the numbers will be averaged.
Community
✅ Growth
- Followers: Total number of followers of our account at the end of the period selected.
- Paid followers: Followers gained through advertising on LinkedIn.
- Impressions: Number of impressions on our page. It includes the impressions on posts published in the period selected.
- Posts: Total number of posts published in the period selected.
- Followers: (variation)Growth in the period selected
- Daily followers: Average number of followers gained or lost in the period selected.
- Followers per post, Daily impressions, Impressions per post, Daily posts: Metrics calculated on average in the period selected.
✅ Balance of followers
It records all the follower changes that occurred in the time span selected. If a new follower stops following us and then starts following us again on different days, it will count as 2 followers. This includes deleted or restricted accounts.
This metric is meant to analyze the reaction of our community to our publications and see which days gain or lose the most followers.
New followers: Balance of followers gained or lost in the period selected.
Posts
✅ Summary
- Engagement: Interactions received per 1000 impressions. (Comments + Reactions + Clicks)/ Impressions * 1000.
- Interactions: How many times users comment, like or click on posts published in the period selected.
- Impressions: Total number of times that posts has been shown.
- Posts: Total number of posts published in the period selected.
✅ Interactions
- Reactions: Total number of reactions (like, love, celebrate, insightful, curious) received on posts published in the period selected.
- Comments: Total number of comments received on posts published in the period selected.
- Clicks: Total number of clicks on posts published in the period selected.
- Posts: Total number of posts published in the period selected.
- Daily reactions, Reactions per post, Daily comments, Comments per post, Daily clicks and Clicks per post: average between the total data and the selected time range.
✅ List of posts
- Date: Date of post.
- Reactions: Reactions (like, love, celebrate, insightful, curious) received on each post published in the period selected.
- Comments: Comments received on each post published in the period selected.
- Clicks: Clicks on each post published in the period selected.
- Impressions: Total number of impressions on each post.
- Engagement: Engagement of our publications. It is defined as the interactions received per 1,000 impressions.
- Video views: Number of times your video post has been viewed for at least three seconds.
- Viewers: Number of people who have seen your video.
- Time watched: Average time videos have been played. The metric is calculated in seconds.
- Avg. time watched: the average viewing time of the video.
The data for this social network is organic + paid data.
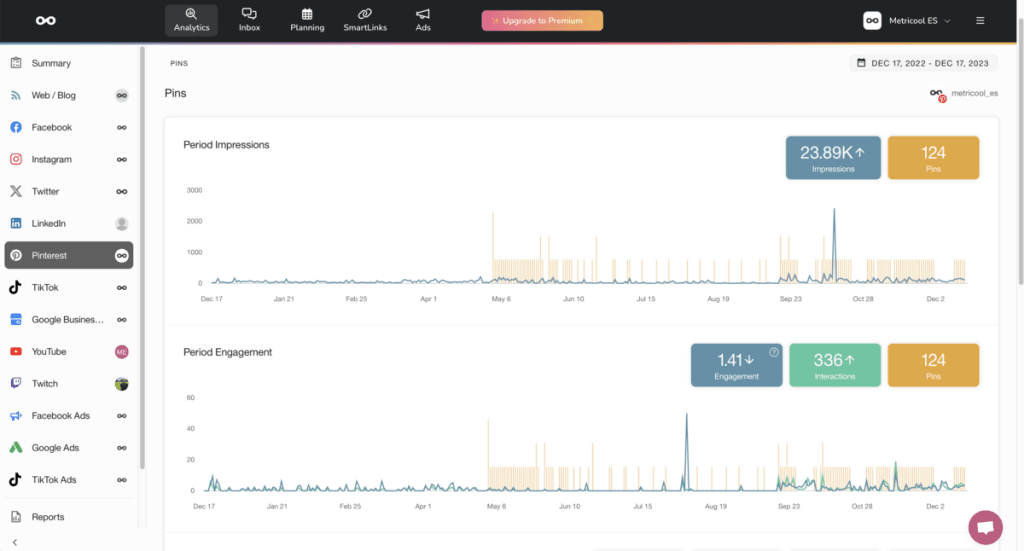
Pins
✅ Period Impressions
- Impressions: Total number of times our posts have been shown in the selected period.
- Pins: Number of pins published by the account in the selected period.
✅ Engagement
- Engagement: engagement of your posts. Engagement for Pinterest is the interactions received per 100 impressions (total interactions / total impressions x 100). It includes the data of saves, clicks and outgoing clicks.
- Interactions: total number of all type of interactions for the period. Includes saves, swipes on Pins carousel cards, clicks on secondary creative content (collections) and swipes forward/backward on Idea Pins.
- Pins: number of pins published by the account in the selected period.
✅ Period Interactions
- Pin Clicks: total number of clicks on the pins in the period. This data already includes outbound clicks.
- Outbound clicks: The number of times people take actions that take them to a destination outside of Pinterest.
- Saves: total number of pins saved by other users.
- Pins: Number of pins published by the account in the selected period.
✅ Pins (total organic data)
- Impressions: Total number of times the post has been shown in the selected period.
- Saved: Total number of times the post has been saved.
- Pin clicks: Total number of clicks on the pin in the period
- Outbound clicks: The number of times people take actions that take them to a destination outside of Pinterest.
- Video views: Number of times your video post has been viewed.
- Avg. watch time: the average viewing time of the video. Is considered a video view when the video is viewed for at least 2 seconds with 50% of video in view.
TikTok
TikTok data is organic + paid data. The metrics we can obtain for personal TikTok accounts are less than for business TikTok accounts, for which we can obtain more data.
TikTok personal account metrics
Videos
✅ Views
- Views: total number of views of our videos in the selected period.
- Videos: total number of videos in the selected period.
✅ Interactions
- Interactions: total number of interactions for the period.
- Likes: total number of Likes for the period.
- Comments: total number of Comments for the period.
- Shares: total number of Shares for the period.
- Videos: total number of videos in the selected period.
✅ Interactions
- Date: date of publication of the video.
- Views: total number of views of the video.
- Likes: total number of Likes for the video.
- Comments: total number of comments on the video.
- Shares: total number of times the video has been shared.
- Duration: duration in seconds of the video.
TikTok business account metrics
Community
✅ GROWTH
- Followers: total number of followers at the end of the selected time range.
- Videos: total number of videos in the selected time range.
✅ BALANCE OF FOLLOWERS
The follower balance records all the movements of our followers. If a new follower for example unfollows us and then follows us again on different days, it would count as two followers. In addition, this section also takes into account users with restricted or deleted accounts.
The Balance of followers is designed to see the response of our community to our publications and to see which days we have lost or gained more followers.
Demographics
Demographics: Gender and followers by country. TikTok will only generate them from 100 followers. It is possible to view it as a graph or as a table.
Account
✅ PROFILE
- Profile views: Visits to our TikTok account profile.
- Videos: total number of videos in the selected period.
Videos
✅ SUMMARY
- Engagement: engagement of our videos. Engagement is defined as interactions received per 1000 people reached: total interactions / reach * 1000.
- Interactions: total interactions of our videos in the selected period.
- Avg. reach per post: average reach of our videos in the selected period.
- Video views: total views of our videos in the selected time range.
- Videos: total number of videos in the selected period.
✅ INTERACTIONS
- Likes: total number of Likes achieved in the period.
- Comments: total number of Comments in the selected range.
- Shares: total number of Shares in the period.
- Videos: total number of videos in the selected period.
✅ LIST OF VIDEOS
- Date: date of publication of the video.
- Views: total number of views of the video.
- Likes: total number of Likes of the video.
- Comments: total number of comments on the video.
- Shares: total number of times the video has been shared.
- Reach: total reach of the video.
- Duration: duration in seconds of the video.
YouTube
Community
✅ Growth
- Subscribers: total number of channel subscribers at the end of the period selected.
- Video views: total number of video views in the selected period.
- Revenue: total income in the selected period.
- Videos: total number of videos posted. It includes videos that have been hidden.
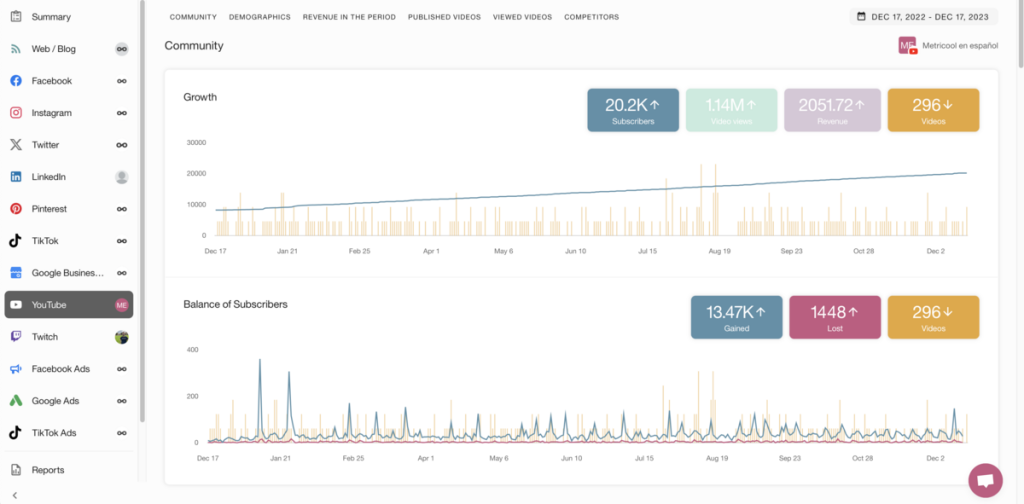
✅ Balance of Subscribers
- Gained: Balance of subscribers gained. In this section, all the movements of our subscribers are registered. For instance, if a subscriber unsubscribes and then subscribes again, it would count as two subscribers. This balance is designed to see the response of our community to our publications.
- Lost: Balance of lost subscribers. It is measured the same way as Gained subscribers.
- Videos: Total videos posted. It includes hidden videos.
✅ Demographics
Gender, age, viewers by country and traffic source. The information relative to gender and viewers by country can be analyzed in a chart or table. YouTube provides the data for unique viewers.
In the case of countries, this data is based on the IP address of the viewers. In terms of age and gender, they are based on viewers logged in on any device.
It is also important to note that YouTube may display the demographics of a limited group of viewers. The data may not represent the overall composition of your traffic.
Revenue in the period
These metrics will only be collected in the case of channels that belong to the YouTube Partner Program.
✅ Videos with revenue
- Date: Video publication date
- Total revenue: total video revenue.
- Partner revenue: Income earned from the video within the Partner Program.
- Ad revenue: Income specifically earned from video advertising.
- Impressions: Number of times the ads in the video have been shown to users.
- Monetized playbacks: The number of times your video was watched with ads.If your video is viewed 10 times, and 8 of those views contained ads, you would have 10 views and 8 estimated monetized playbacks. More info.
Published videos
This section shows metrics for the videos published in the selected period.
- Video views: The number of times your video has been watched. It includes hidden videos.
- Likes: Total number of likes in the selected period.
- Dislikes: Total number of dislikes in the selected period.
- Comments: Total number of comments in the selected period.
- Videos: Total number of videos published in the time frame selected.
✅ List of videos
- Date: Date and time of publication of the videos.
- Video Views: Total number of views of the video. (if the data is shown as a negative value, it is because YouTube subtracts views from a channel if it considers that the views are fraudulent, that is, made with bots or automatically).
- Watch Time: the total amount of time viewers have watched your videos (minutes)
- Avg. views duration: average watch time of your video divided by the total number of video plays (seconds)
- Likes: Total number of likes of the video.
- Dislikes: Total number of dislikes of the video.
- Comments: Total number of comments of the video.
- Shares: Total number of times that the video has been shared.
Viewed videos
This section collects data on videos that have generated views in the selected period, regardless of when they were published.
- Video views: total number of video views in the selected period.
- Likes: total number of likes in the selected period.
- Dislikes: total number of dislikes in the selected period.
- Comments: total number of comments in the selected period.
✅ List of videos
- Date: date and time of publication of the videos.
- Video views: total number of views of the video (if the data is shown in negative, it is because Youtube subtracts views from a channel if it considers that they are fraudulent views made with bots or automatically).
- Watch time: Total viewing time of the video.
- Avg. views duration: Total playing time of your video divided by the total number of views of the video.
- Likes: total number of likes of the video.
- Dislikes: total number of dislikes of the video.
- Comments: total number of comments on the video.
- Shares: total number of times the video has been shared.
Competitors
✅ List of Competitors
- Subscriptions Total number of subscribers of the competitor.
- Total views: Total views of the competitor’s videos.
- Videos: Total number of videos posted by the competitor.
- Likes: Average number of likes received divided by the competitor’s videos published in the analyzed period.
- Dislikes: Average number of dislikes received divided by the competitor’s videos published in the analyzed period.
- Comments: Average number of comments received divided by the competitor’s videos published in the analyzed period.
Twitch
Community
✅ Growth
- Followers: Total number of followers at the end of the period selected.
- Subscribers: Total number of subscribers at the end of the period selected.
- Videos: Total number of videos posted in the period selected.
✅ Balance of Followers
It records all the follower changes that occurred in the time span selected. If a new follower stops following us and then starts following us again on different days, it will count as 2 followers. This metric is meant to analyze the reaction of our community to our publications.
Subscriptions
✅ Subscribers
- Tier 1: Tier 1 Subscription.
- Tier 2: Tier 2 Subscription.
- Tier 3: Tier 2 Subscription.
- Gifts: Total gifts.
- Videos: Total number of videos posted in the period selected.
✅ Subscribers distribution and List of subscribers
Graph or table of the distribution of our subscribers and gifts and list of subscribers with date and type of subscription.
Streams
✅ Summary
- Views: total number of views for the selected period.
- Duration: total duration of the streams for the selected period.
- Videos: total number of videos for the selected period.
✅ List of videos
- Date: date of the video.
- Duration: duration of the video.
- Total views: total views of the video.
✅ List of clips
- Title: title of the clip.
- Date: date of the clip.
- Video: title of the video from which the clip was taken.
- Game: game to which the clip belongs.
- Total views: total views of the clip.
Competitors
✅ List of competitors
- Name: name of the competitor.
- Followers: total number of subscribers of the competitor in the selected period.
- Videos: total number of videos of the competitor in the selected period.
- Clips: total number of clips of the competitor in the selected period.
- Views: total number of views of the competitor in the selected period.
Google Ads
Account
✅ Reach
- Impressions: Total number of times that our campaigns have been shown.
- Spent: Total spent on Google Ads in the period selected.
✅ Results
- Clicks: Total number of clicks on our campaigns.
- Conversions: Total number of conversions.
- Spent: Total spent on Google Ads in the period selected.
✅ Performance
- CPM: Cost per thousand impressions. Spent / Impressions x 1000.
- CPC: Cost per click. Spent / Clicks.
- CTR: Click Through Rate. Clicks / Impressions x 100.
- Spent: The total spent on all the campaigns created in the period selected.
✅ Revenue
- Conversion value: revenue we have obtained from the sales of our product on our website. As it is an event that takes place on our side (our website), it is important that we allow Facebook and Google to measure it, otherwise we will not be able to obtain this data.
- ROAS: Revenue on Ads Spent. It tells us how much each euro invested in the campaign has generated. In this way we can compare campaigns with different investments to see which is more profitable. The calculation of this metric is: Conversion Value / Spending
- Spent: Total spend on Google Ads in the selected period.
Campaigns
✅ List of campaigns
- Updated: Start date of the campaign.
- Impressions: Number of impressions of each campaign.
- Clicks: Number of clicks for each campaign.
- Conversions: Number of conversions for each campaign
- CPM: Cost per thousand impressions. Spent / Impressions x 1000
- CPC: Cost per click. Spent / Clicks
- CTR: Click Through Rate. Clicks / Impressions x 100
- Conversion value: revenue we have obtained from the sales of our product on our website. As it is an event that takes place on our side (our website), it is important that we allow Facebook and Google to measure it, otherwise we will not be able to obtain this data.
- ROAS: Revenue on Ads Spent. It tells us how much each euro invested in the campaign has generated. In this way we can compare campaigns with different investments to see which is more profitable. The calculation of this metric is: Conversion Value / Spending
- Spent: The spent on each campaign in the period selected
Keywords
✅ List of keywords
- Impressions: Number of impressions received by each keyword.
- Clicks: Number of clicks on each keyword.
- Conversions: Number of conversions achieved by each keyword.
- CPM: Cost per thousand impressions. Spent / Impressions x 1000.
- CPC: Cost per click. Spent / Clicks
- CTR: Click Through Rate. Clicks / Impressions x 100
- Spent: The spent incurred in each keyword.
Google My Business
Location
✅ Queries
- Direct: When someone searches for a business directly, for instance: McDonald’s Barcelona.
- Indirect: When the search is generic. For example, Restaurants in Barcelona. In the first Google results will appear McDonald’s Barcelona.
- Chain: This metric gathers the information when the searches are about chains. Following the same example, it would be the times that the McDonald’s in Barcelona appeared in the first results when users look for McDonald’s, that is, the chain of restaurants in general.
- Total: The total number of searches, the sum of all the different ways to look for information about your business, that is, Direct + Indirect + Chains.
✅ Views
- Google Maps: Google Maps organic views
- Google Search: Google search organic views.
- Total: Total number of views.
✅ Clicks
- Website: Number of clicks on the button to access the business’s website.
- Phone: Number of clicks on the button to call and contact the business by phone.
- Directions: Number of clicks on the button to how to get to the business location.
- Total: Total of clicks on all of the buttons combined
Reviews
✅ Reviews
- Star Rating: Average score of your Google My Business listing.
- Total: Total number of reviews received.
✅ List of reviews
- User: The name of the user who wrote the review.
- Message: Review text.
- Date: Review Date.
- Star Rating: Rating given by the user.
- Replied: Whether the review has been replied to or not.
✅ Photos and videos
- Views: Number of times the photos or videos in your listing has been seen. Photos and videos uploaded directly by your business and by other users.
- Total: Total number of photos and videos uploaded in the period selected.
✅ List of photos and videos
- Date: Date that the photo or video was uploaded.
- Views: Views of each photo or video.
- Type: Type of publication, photos or videos.
✅ Posts
- Views: Number of times the posts published in the period selected has been visited.
- Total: Total number of posts published in the period selected.
✅ List of posts
- Date: Date of the publication
- Visits: Visits received by each publication.
- Type: Photo or Video
⚠️ IMPORTANT: When you plan content with Metricool, this is what you can publish:
- Text: A post is published
- Text + link: The post is published with a button and a photo if it’s possible to obtain one highlighted from the link.
- Text + link + image: A post with an image and button.
- Text + image: A photo is published in the photos section in the Google My Business listing.
TikTok Ads
Account
✅ Reach
- Impressions: Total impressions achieved by the account in the selected period.
- Cost: It is the total cost of all campaigns. It is displayed in the currency in which the TikTok Ads account is set up.
✅ Results
- Clicks: Total number of clicks received in your ad campaigns
- Conversions: Total number of conversions achieved by all your ad campaigns.
- Cost: It is the total cost of all campaigns. It is displayed in the currency in which the TikTok Ads account is set up.
✅ Performance
- CPM: Cost per thousand impressions. The formula is: Spent / Impressions x 1000
- CPC: Cost per click. Spent / Clicks
- CTR: Click Through Rate. Clicks / Impressions x 100.
- Cost: It is the total cost of all campaigns. It is displayed in the currency in which the TikTok Ads account is set up.
Campaigns
✅ List of Campaigns
- Name and Updated of the creation of the ad campaign.
- Impressions: Total impressions per campaign.
- Clicks: Total clicks received by each campaign.
- Conversions: Total number of conversions by campaign
- CPM, CPC, CTR and Cost of each campaign.
And up to here, all the metrics that you will find in Metricool’s dashboard and reports. We hope they will help you to get a better understanding of your performance.
Do you have any questions? We will read your comments!
All your metrics in one click? 👇🏻