

Like most websites, we use own and third party cookies for analytical purposes and to show you personalised advertising or based on your browsing habits.
Generally, the information does not directly identify you, but can provide you with a more personalised web experience. Because we respect your right to privacy, you may choose not to allow us to use certain cookies. However, blocking some types of cookies may affect your experience on the site and the services we can offer.
For more information, you can read our cookie policy.
10 Important Social Media Metrics to Measure in 2024
With Q1 already on the horizon, we are searching for new ways to improve our strategies, grow our accounts, boost conversions, etc. Let’s be honest, data collection is no joke, and analytics can become confusing, unorganized, and overwhelming. But don’t worry, we are here to tell you the top 10 most important social media metrics to analyze and measure in 2024.
What Are Social Media Metrics?
Social media metrics measure how your social media strategy and digital marketing efforts are performing. These data points can give insight into what has worked well, and what hasn’t, so you can continue to refine your strategy. Social media metrics tell us how content was received by users depending on likes, comments, shares, reposts, watch time, etc.
We are no longer in the days of worrying only about the following count. Now, any profile’s content can go viral as long as the content is high quality. That’s why analyzing social media metrics is critical to seeing how much money and effort you’re putting into different strategies, and if they are helping you reach your goals.
How are social media metrics and social media goals related?
Social media metrics and social media goals go hand in hand. By first defining your specific goals and what you want to achieve, you can analyze data relevant to these objectives. For example, if a brand’s goal was to increase website traffic, it would probably analyze metrics such as clicks, conversion rate, and cost-per-click.
10 Important Social Media Metrics to Analyze Your Content
Let’s get into it, the top 10 most important social media metrics to measure in 2024! By analyzing this data, you can measure how your tactics are working and see what content is performing best. Plus, you can measure data across multiple social media channels, to find which network works best for your audience and brand.
Although reactions, likes, and comments are important metrics, I think we can agree that these metrics don’t sum up a content’s quality. So, let’s see 11 more social media metrics, what they mean, and how to find them:
Engagement rate
Having information about engagement on social media is extremely valuable in understanding your audience and what content they are more likely to interact with. Keeping your audience engaged can be a hard task to accomplish, so for content that has a lot of engagement, you can assume users will enjoy similar content.
The average engagement rate is calculated by the total interactions divided by the total number of followers, multiplied by 100.
To find the engagement rate for individual posts, you can calculate this by taking the total interactions of that post, dividing that by the total number of impressions, and multiplying by 100.
Reach
Reach is exactly what it sounds like, how many people your content reaches. In other words, the number of people that see your content. As we know, algorithms favor content that is well-received by an audience. If this is the case, the content will be prioritized to appear in front of more users.
Also, by viewing the percentage of followers and non-followers who saw your content, you can see if this content was highly shared or favored by the algorithm.
Impressions
This metric is similar to reach but measures the number of times people saw your content, no matter if it was clicked on or not. Impressions can tend to be higher than reach since users can view your content more than once.
If your impressions are much higher than your reach, this means that people come back to look at your content. This can help you understand which content tends to engage users and why they are coming back to your content.
Click-through rate (CTR)
This metric only pertains to clickable content and measures the rate at which users click on linked content in a blog, website, etc. CTR shows you if people were engaged enough to click through other links and view more of your content.
To find the CTR, you can divide the total number of clicks by the total number of impressions and multiply 100 to find your CTR rate.
Cost per click (CPC)
Cost per click is only relevant to paid advertising, which tells you how much you pay the platform for each click on your ad. Therefore, your goal is ultimately to have a low CPC, so you can have a higher budget for advertising.
Cost per click is calculated by the total money spent on the ad divided by the total number of clicks multiplied by 1000. CPC can help you compare ad campaigns against each other to view what has worked best and how you can improve your advertising strategies.
Cost per Thousand Impressions (CPM)
Also known as “Cost per Mile”, CPM measures the cost you pay for every thousand impressions on your post. As mentioned above, impressions are those that view your content, so this is calculated by taking the total ad money spent, divided by the total ad impressions multiplied by 1000.
Therefore this metric is more interested in views than interaction. With this, you can understand which ads are receiving more views. We recommend running A/B testing on ads and using these metrics to see how your ads compare.
Virality rate
Sharing is caring, and on social media, shares are gold. The virality metric shows how many times the content was shared. We all know the feeling of finding content that is perfect to share with your friends or followers. This can create a domino effect, thus helping your content go viral.
So the higher your virality rate, the more your content is being shared. However, going viral doesn’t happen all the time, even if we wish it did. Keep track of your content’s shares to see what is getting passed on to other users.
Video views
When it comes to Reels, TikTok, Shorts, and all other video content on social media, seeing how many people watched your video is important. This indicates how many people came across your video.
However, keep in mind that this metric doesn’t necessarily mean viewers watched the whole video since clicking on and watching a video for a few seconds counts as a video view.
Watch time
When it comes to measuring how engaged your viewers are, watch time is an extremely important metric. A higher watch time indicates that viewers were more likely to watch your whole video, rather than skipping out early.
For videos that have higher watch times, you can assume that this content is engaging, and should be replicated for future content.
Audience growth
Although followers aren’t everything, it’s still important to understand how your following is changing. This metric tells you how many followers you have gained and lost in a specific period. We can expect smaller accounts to have higher audience growth, over accounts with a mass following.
Overall, you want to build a community on social media and retain followers to stay engaged and invested in your brand. Measuring audience growth is important to view how your account has evolved and grown over time.
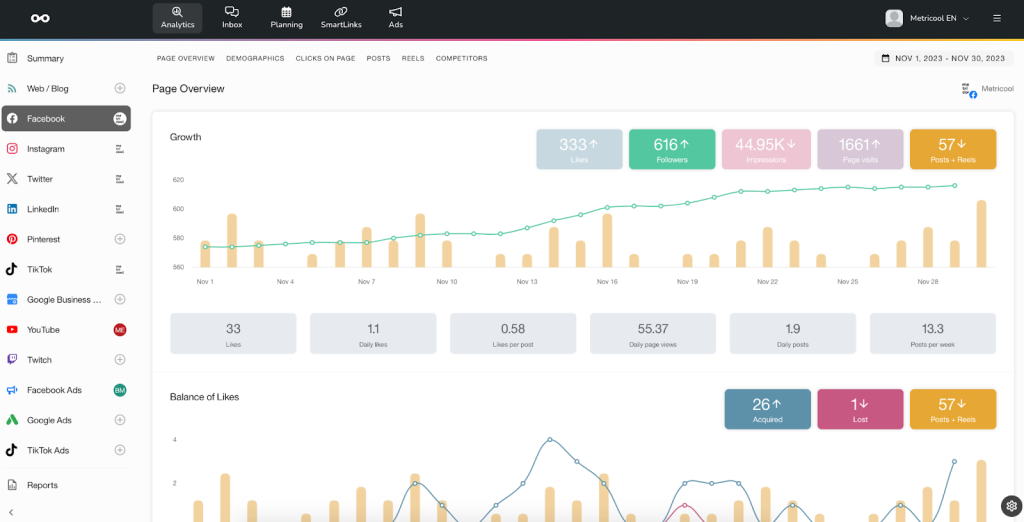
Metricool, A Free Social Media Analytics Platform
What if I told you that you could find all these metrics for free? Well with Metricool it’s possible. Thanks to our expansive Analytics section, you can have data about all of your social media content at hand.
Our platform is approved for nine different social media channels, allowing you to have a complete dashboard of social media metrics, without having to jump between platforms and sections.
Inside our Analytics dashboard, you can find each social media network. From here, view overall account summaries, demographics, as well as individual posts, Stories, Reels, and videos. You can even see your top-performing posts for each platform and view competitor analytics.
Want to see your social media metrics? Create your FREE Metricool account and never manually collect data again.